
Compare Semac Construct with Similar Stocks
Dashboard
Weak Long Term Fundamental Strength with an average Return on Equity (ROE) of 8.54%
- Poor long term growth as Net Sales has grown by an annual rate of 12.91% and Operating profit at 13.25% over the last 5 years
- Company's ability to service its debt is weak with a poor EBIT to Interest (avg) ratio of -1.62
With a growth in Net Profit of 189.17%, the company declared Outstanding results in Mar 26
With ROE of 8.8, it has a Very Attractive valuation with a 1.2 Price to Book Value
Majority shareholders : Promoters
Consistent Underperformance against the benchmark over the last 3 years
Total Returns (Price + Dividend) 
Latest dividend: 5 per share ex-dividend date: Oct-19-2023
Risk Adjusted Returns v/s
Returns Beta

News

Semac Construction Ltd Locks at Upper Circuit With 4.99% Gain — Buyers Queue, Sellers Absent
At Rs 333.5, the buying was done — not because demand dried up, but because the exchange wouldn't let the stock go any higher. Semac Construction Ltd locked at its upper circuit of 4.99% on 13 Jul 2026, with buyers queuing and no sellers willing to part with shares.
Read full news article
Golden Cross Forms in Semac Construction Ltd — Mixed Technical Signals and Fundamental Context
The 50-day moving average has crossed above the 200-day moving average for Semac Construction Ltd, signalling a golden cross on 09 Jul 2026. Yet, the broader technical picture and fundamental backdrop present a nuanced scenario that tempers the enthusiasm typically associated with this crossover — how reliable is this signal in the current context?
Read full news article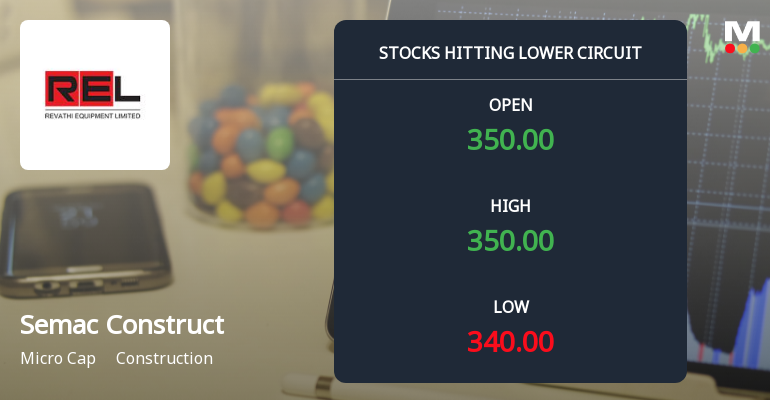
Semac Construction Ltd Locks at Lower Circuit With 4.92% Loss — Sellers Queue, No Buyers in Sight
At Rs 330.60, Semac Construction Ltd locked at its lower circuit on 7 Jul 2026, falling 4.92% within a 5% price band. Sellers were lined up to exit, but no buyers emerged to absorb the supply, resulting in a frozen price and unfilled sell orders that highlight the liquidity challenges facing this micro-cap stock.
Read full news article Announcements
Revathi Equipment Limited - Updates
01-Nov-2019 | Source : NSERevathi Equipment Limited has informed the Exchange regarding 'Submission of News Paper publication of Notice of Board Meeting dated 06th November, 2019 - Reg.'. In continuation of our filing of intimation of Board meeting to be held on 06th November, 2019, to consider inter alia the Un-audited financial results of the company for the quarter ended 30th September, 2019, we now send herewith copies of Notice published in Malai Murasu anp Business Standard on 26th October, 2019, in accordance with regulation 47 of SEBI (Listing Obligations and Disclosure Requirements) Regulations, 2015.
Shareholders meeting
12-Sep-2019 | Source : NSE
| Revathi Equipment Limited has submitted the Exchange a copy Srutinizers report of Annual General Meeting held on September 10, 2019. Further, the company has informed the Exchange regarding voting results. |
Shareholders meeting
11-Sep-2019 | Source : NSE
| Revathi Equipment Limited has informed the Exchange regarding Proceedings of Annual General Meeting held on September 10, 2019 |
Corporate Actions

No Upcoming Board Meetings

Semac Construction Ltd has declared 50% dividend, ex-date: 19 Oct 23

No Splits history available

No Bonus history available

No Rights history available
Quality key factors
Valuation key factors
Technicals key factors
 Technical Indicator Scale: Bearish, Mildly Bearish, Sideways, Mildly Bullish, Bullish Turned
 Shareholding Snapshot : Mar 2026
Shareholding Compare (%holding)
Promoters
None
Held by 0 Schemes
Held by 1 FIIs (0.04%)
Ajai Hari Dalmia Trust (45.68%)
Rhea Dipak Shah (1.23%)
28.21%
Quarterly Results Snapshot (Consolidated) - Mar'26 - QoQ

QoQ Growth in quarter ended Mar 2026 is 26.98% vs 2.90% in Dec 2025

QoQ Growth in quarter ended Mar 2026 is 237.86% vs 14,100.00% in Dec 2025
Half Yearly Results Snapshot (Consolidated) - Sep'25
Growth in half year ended Sep 2025 is 103.51% vs -28.65% in Sep 2024
Growth in half year ended Sep 2025 is 118.71% vs -205.49% in Sep 2024
Nine Monthly Results Snapshot (Consolidated) - Dec'25
YoY Growth in nine months ended Dec 2025 is 68.60% vs -2.87% in Dec 2024
YoY Growth in nine months ended Dec 2025 is 135.36% vs 57.69% in Dec 2024
Annual Results Snapshot (Consolidated) - Mar'26
YoY Growth in year ended Mar 2026 is 40.42% vs 35.57% in Mar 2025
YoY Growth in year ended Mar 2026 is 220.71% vs 81.63% in Mar 2025
About Semac Construction Ltd

Company Coordinates


