
Compare Sera Investments with Similar Stocks
Dashboard
Company has a Debt to Equity ratio (avg) of 0.02 times
Healthy long term growth as Net Sales has grown by an annual rate of 135.56% and Operating profit at 130.57%
With a growth in Net Sales of 66.18%, the company declared Outstanding results in Mar 26
Majority shareholders : Promoters
Market Beating performance in long term as well as near term
Stock DNA
Non Banking Financial Company (NBFC)
INR 259 Cr (Micro Cap)
5.00
21
0.00%
-0.94
18.11%
0.92
Total Returns (Price + Dividend) 
Latest dividend: 0.10000000000000002 per share ex-dividend date: Sep-23-2024
Risk Adjusted Returns v/s
Returns Beta

News
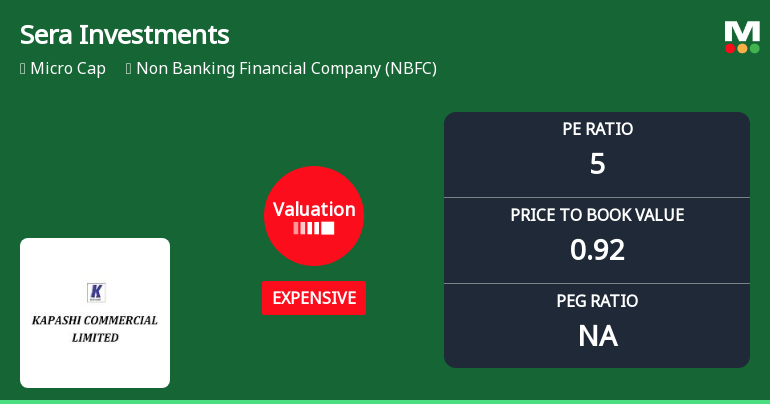
Sera Investments & Finance India Ltd: Valuation Shifts Signal Price Attractiveness Amid Market Volatility
Sera Investments & Finance India Ltd has undergone a notable change in its valuation parameters, shifting from a very expensive to an expensive rating. This recalibration, driven primarily by its price-to-earnings (P/E) and price-to-book value (P/BV) ratios, signals a nuanced shift in price attractiveness within the competitive Non Banking Financial Company (NBFC) sector. Investors are now reassessing the micro-cap’s prospects amid broader market volatility and sectoral trends.
Read full news article
Sera Investments & Finance India Ltd is Rated Buy
Sera Investments & Finance India Ltd is rated 'Buy' by MarketsMOJO, with this rating last updated on 28 April 2026. However, the analysis and financial metrics presented here reflect the stock's current position as of 01 June 2026, providing investors with the latest insights into its performance and outlook.
Read full news article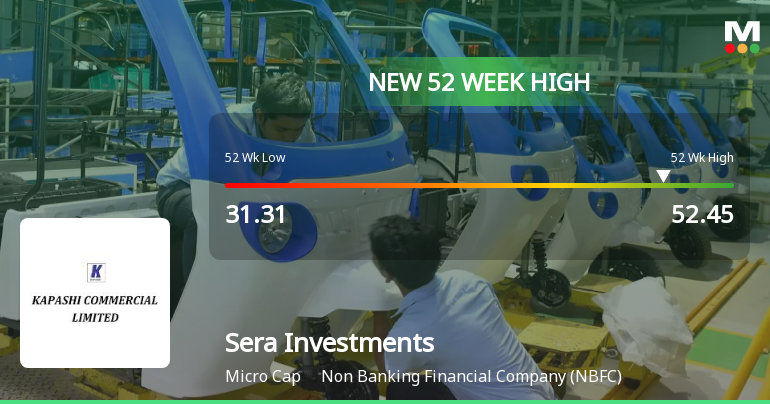
Broad-Based Technical Strength Lifts Sera Investments & Finance India Ltd to 52-Week High of Rs 52.45
Surging past Rs 52.45 on 25 May 2026, Sera Investments & Finance India Ltd has reached a fresh 52-week high, propelled by a confluence of bullish technical indicators and sustained price momentum that has captivated market attention.
Read full news article Announcements
Reconstitution Of Audit And Stakeholders Relationship Committee.
02-Jun-2026 | Source : BSEReconstituion of Audit and Stakeholders Relationship committee with reference to board meeting held on 2nd June 2026.
Announcement under Regulation 30 (LODR)-Resignation of Director
02-Jun-2026 | Source : BSEBoard meeting for Resignation of Whole time Director held on 2nd June 2026.
Board Meeting Outcome for Outcome Of Board Meting For Resignation Of Whole Time Director
02-Jun-2026 | Source : BSEBoard meeting for resignation of Mr Sagar Samir Shah from the post of whole time director
Corporate Actions

No Upcoming Board Meetings

Sera Investments & Finance India Ltd has declared 5% dividend, ex-date: 23 Sep 24

Sera Investments & Finance India Ltd has announced 2:10 stock split, ex-date: 28 Apr 23

Sera Investments & Finance India Ltd has announced 3:2 bonus issue, ex-date: 14 May 19

No Rights history available
Quality key factors
Valuation key factors
Technicals key factors
 Technical Indicator Scale: Bearish, Mildly Bearish, Sideways, Mildly Bullish, Bullish Turned
 Shareholding Snapshot : Mar 2026
Shareholding Compare (%holding)
Promoters
None
Held by 0 Schemes
Held by 2 FIIs (4.12%)
Seraphiim Ventures Private Limited (17.99%)
Eriska Investment Fund Ltd (4.12%)
26.78%
Quarterly Results Snapshot (Consolidated) - Mar'26 - QoQ

QoQ Growth in quarter ended Mar 2026 is 66.18% vs 1,089.62% in Dec 2025
QoQ Growth in quarter ended Mar 2026 is 63.75% vs 2,889.55% in Dec 2025
Half Yearly Results Snapshot (Standalone) - Sep'25
Growth in half year ended Sep 2025 is -46.66% vs 136.73% in Sep 2024
Growth in half year ended Sep 2025 is -82.59% vs -17.02% in Sep 2024
Nine Monthly Results Snapshot (Standalone) - Dec'25

YoY Growth in nine months ended Dec 2025 is 220.79% vs -27.45% in Dec 2024
YoY Growth in nine months ended Dec 2025 is 3,946.15% vs -96.39% in Dec 2024
Annual Results Snapshot (Consolidated) - Mar'26
YoY Growth in year ended Mar 2026 is 519.76% vs -49.30% in Mar 2025
YoY Growth in year ended Mar 2026 is 1,914.29% vs -85.11% in Mar 2025
About Sera Investments & Finance India Ltd

Company Coordinates


