
Compare Seshaasai Tech. with Similar Stocks
Dashboard
High Management Efficiency with a high ROE of 0%
Strong ability to service debt as the company has a low Debt to EBITDA ratio of 0.22 times
Poor long term growth as Net Sales has grown by an annual rate of 0% over the last 5 years
Positive results in Mar 26
With ROE of 17, it has a Expensive valuation with a 3.1 Price to Book Value
Falling Participation by Institutional Investors
Stock DNA
Computers - Software & Consulting
INR 4,311 Cr (Small Cap)
19.00
20
0.00%
-0.23
17.05%
3.09
Total Returns (Price + Dividend) 
Seshaasai Tech. for the last several years.
Risk Adjusted Returns v/s
Returns Beta

News

Seshaasai Technologies Ltd Shows Signs of Mild Bullish Momentum Amid Technical Upgrades
Seshaasai Technologies Ltd, a small-cap player in the Computers - Software & Consulting sector, has recently exhibited a shift in price momentum, moving from a sideways trend to a mildly bullish stance. This change is supported by a combination of technical indicators including MACD, Bollinger Bands, and moving averages, signalling a potential positive phase for the stock after a period of consolidation.
Read full news article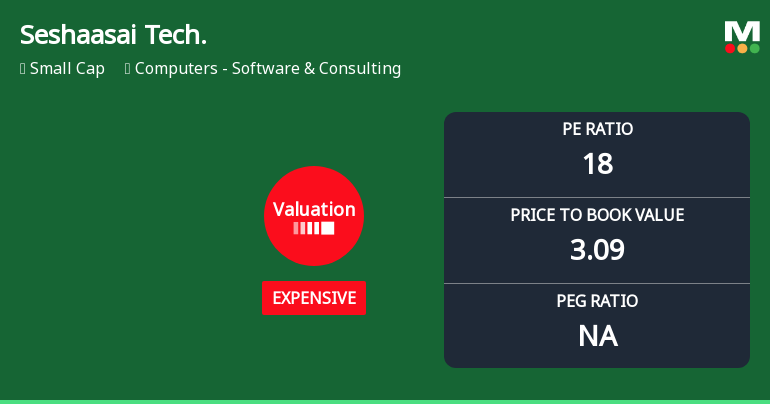
Seshaasai Technologies Ltd Valuation Shifts Signal Changing Market Sentiment
Seshaasai Technologies Ltd, a small-cap player in the Computers - Software & Consulting sector, has witnessed a notable shift in its valuation parameters, moving from a fair to an expensive rating. This change reflects evolving market perceptions and prompts a closer examination of its price-to-earnings (P/E) and price-to-book value (P/BV) ratios relative to historical averages and peer benchmarks.
Read full news article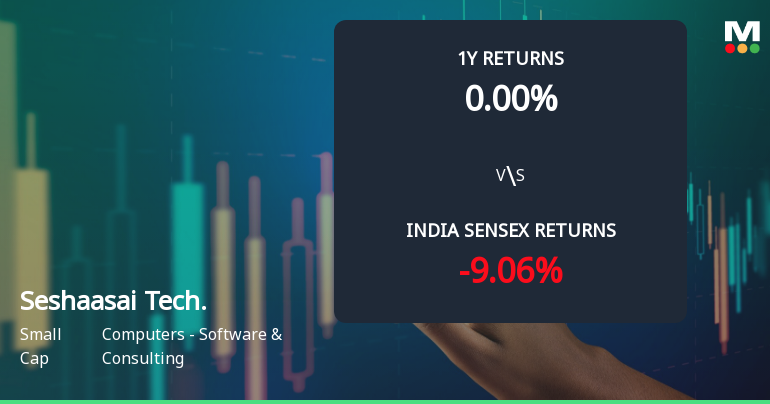
Seshaasai Technologies Ltd Technical Momentum Shifts Amid Sideways Trend
Seshaasai Technologies Ltd, a small-cap player in the Computers - Software & Consulting sector, has experienced a notable shift in its technical momentum, moving from a mildly bullish stance to a sideways trend. This transition is underscored by mixed signals from key technical indicators such as MACD, RSI, and moving averages, reflecting a period of consolidation after recent gains.
Read full news article Announcements
Compliances-Reg.24(A)-Annual Secretarial Compliance
27-May-2026 | Source : BSEAnnual Secretarial Compliance Report as per Regulation 24A of Listing Regulations
Announcement under Regulation 30 (LODR)-Earnings Call Transcript
26-May-2026 | Source : BSETranscript for Q4FY26 Earnings conference call
Announcement under Regulation 30 (LODR)-Newspaper Publication
20-May-2026 | Source : BSESubmission of copy of newspaper advertisement dated May 20 2026
Corporate Actions

No Upcoming Board Meetings

No Dividend history available

No Splits history available

No Bonus history available

No Rights history available
Quality key factors
Valuation key factors
Technicals key factors
 Technical Indicator Scale: Bearish, Mildly Bearish, Sideways, Mildly Bullish, Bullish Turned
 Shareholding Snapshot : Mar 2026
Shareholding Compare (%holding)
Promoters
None
Held by 12 Schemes (4.15%)
Held by 9 FIIs (0.32%)
Gautam Sampatraj Jain (40.9%)
Florintree Nextech Llp (4.07%)
5.11%
Quarterly Results Snapshot (Standalone) - Mar'26 - QoQ

QoQ Growth in quarter ended Mar 2026 is 7.98% vs 6.51% in Dec 2025
QoQ Growth in quarter ended Mar 2026 is 23.95% vs 15.08% in Dec 2025
Half Yearly Results Snapshot (Standalone) - Sep'25
Not Applicable: The company has declared_date for only one period
Not Applicable: The company has declared_date for only one period
Nine Monthly Results Snapshot (Standalone) - Dec'25
Not Applicable: The company has declared_date for only one period
Not Applicable: The company has declared_date for only one period
Annual Results Snapshot (Consolidated) - Mar'26
YoY Growth in year ended Mar 2026 is -1.50% vs -6.10% in Mar 2025

YoY Growth in year ended Mar 2026 is 7.96% vs 31.33% in Mar 2025
About Seshaasai Technologies Ltd

Company Coordinates


