
Compare Seshaasai Tech. with Similar Stocks
Dashboard
High Management Efficiency with a high ROE of 0%
The company is Net-Debt Free
Poor long term growth as Net Sales has grown by an annual rate of 0% over the last 5 years
Flat results in Jun 26
With ROE of 16.9, it has a Expensive valuation with a 3.9 Price to Book Value
Increasing Participation by Institutional Investors
Stock DNA
Computers - Software & Consulting
INR 5,649 Cr (Small Cap)
21.00
NA
0.00%
-0.23
16.87%
4.00
Total Returns (Price + Dividend) 
Seshaasai Tech. for the last several years.
Risk Adjusted Returns v/s
Returns Beta

News
Seshaasai Technologies Ltd is Rated Hold
Seshaasai Technologies Ltd is rated Hold by MarketsMOJO, with this rating last updated on 04 May 2026. While the rating change occurred on that date, the analysis and financial metrics discussed here reflect the company’s current position as of 29 July 2026, providing investors with the most up-to-date insight into the stock’s fundamentals and market performance.
Read full news article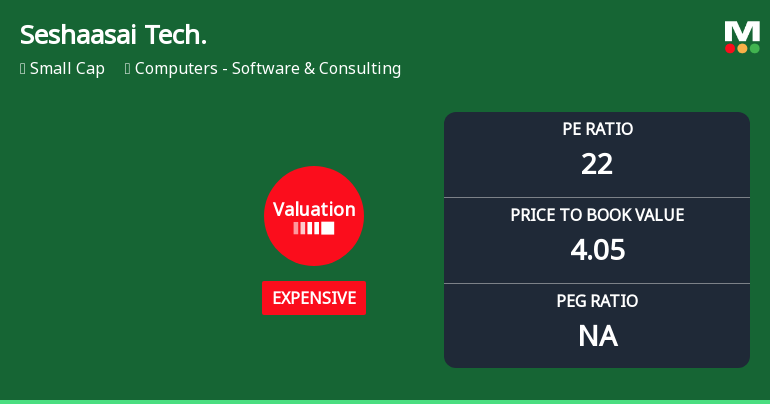
Seshaasai Technologies Ltd Valuation Shifts Signal Changing Market Sentiment
Seshaasai Technologies Ltd, a player in the Computers - Software & Consulting sector, has experienced a notable shift in its valuation parameters, moving from a 'very expensive' to an 'expensive' rating. This article analyses the recent changes in key valuation metrics such as the price-to-earnings (P/E) and price-to-book value (P/BV) ratios, compares them with peer averages and historical benchmarks, and assesses the implications for investors amid a volatile market backdrop.
Read full news article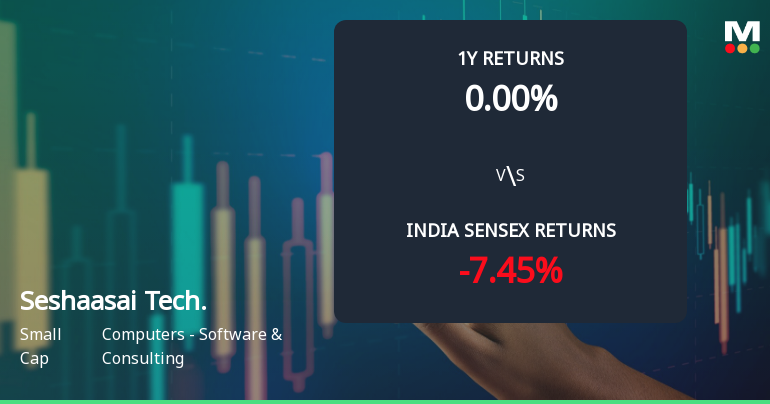
Seshaasai Technologies Ltd Technical Momentum Shifts Signal Bullish Outlook
Seshaasai Technologies Ltd, a small-cap player in the Computers - Software & Consulting sector, has witnessed a notable shift in its technical momentum, upgrading from a mildly bullish to a bullish trend. This change is underscored by improvements in key technical indicators such as the MACD, moving averages, and Bollinger Bands, signalling renewed investor interest despite a recent dip in share price.
Read full news article Announcements
Corporate Actions

No Upcoming Board Meetings

No Dividend history available

No Splits history available

No Bonus history available

No Rights history available
Quality key factors
Valuation key factors
Technicals key factors
 Technical Indicator Scale: Bearish, Mildly Bearish, Sideways, Mildly Bullish, Bullish Turned
 Shareholding Snapshot : Jun 2026
Shareholding Compare (%holding)
Promoters
None
Held by 12 Schemes (5.38%)
Held by 11 FIIs (0.28%)
Gautam Sampatraj Jain (40.9%)
Florintree Nextech Llp (4.07%)
4.94%
Quarterly Results Snapshot (Consolidated) - Jun'26 - QoQ

QoQ Growth in quarter ended Jun 2026 is -6.86% vs 8.14% in Mar 2026
QoQ Growth in quarter ended Jun 2026 is -26.23% vs 27.62% in Mar 2026
Half Yearly Results Snapshot (Standalone) - Sep'25
Not Applicable: The company has declared_date for only one period
Not Applicable: The company has declared_date for only one period
Nine Monthly Results Snapshot (Standalone) - Dec'25
Not Applicable: The company has declared_date for only one period
Not Applicable: The company has declared_date for only one period
Annual Results Snapshot (Consolidated) - Mar'26

YoY Growth in year ended Mar 2026 is -1.50% vs -6.10% in Mar 2025
YoY Growth in year ended Mar 2026 is 7.96% vs 31.33% in Mar 2025
About Seshaasai Technologies Ltd

Company Coordinates


