
Compare Setco Automotive with Similar Stocks
Dashboard
With a Negative Book Value, the company has a Weak Long Term Fundamental Strength
- Poor long term growth as Net Sales has grown by an annual rate of 17.47% and Operating profit at 0% over the last 5 years
- The company has a negative book value of Rs 780.07 crore
- The company has reported losses and also has negative networth. This is not a good sign for the investors. Either company will have to raise fresh capital or report profits to sustain going forward
Flat results in Dec 25
Risky - Negative Book Value
94.59% of Promoter Shares are Pledged
Stock DNA
Auto Components & Equipments
INR 226 Cr (Micro Cap)
NA (Loss Making)
37
77.01%
-1.49
13.92%
-0.29
Total Returns (Price + Dividend) 
Latest dividend: 13 per share ex-dividend date: Jun-02-2026
Risk Adjusted Returns v/s
Returns Beta

News
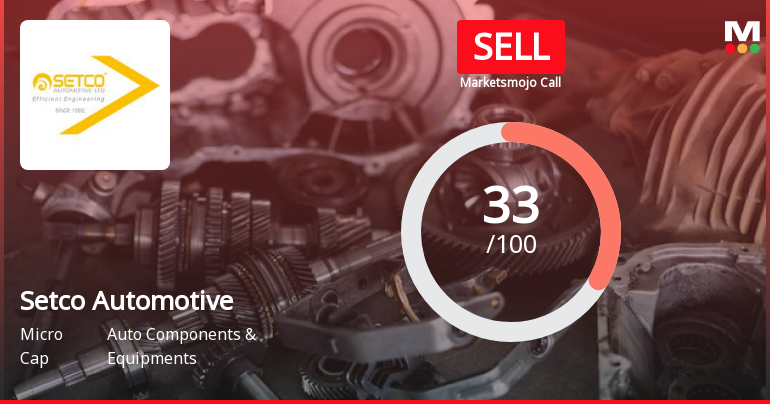
Setco Automotive Ltd is Rated Sell
Setco Automotive Ltd is rated Sell by MarketsMOJO. This rating was last updated on 30 March 2026, reflecting a shift from a previous 'Strong Sell' stance. However, the analysis and financial metrics discussed here represent the stock's current position as of 13 June 2026, providing investors with the latest insights into the company’s performance and outlook.
Read full news article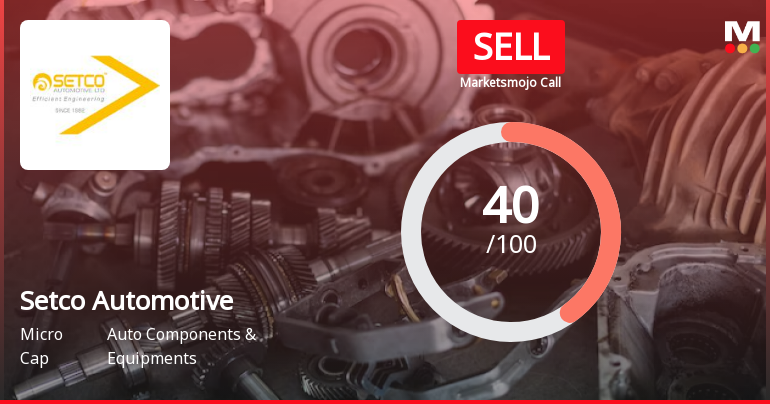
Setco Automotive Ltd is Rated Sell by MarketsMOJO
Setco Automotive Ltd is rated 'Sell' by MarketsMOJO, with this rating last updated on 30 Mar 2026. However, the analysis and financial metrics discussed here reflect the company’s current position as of 28 May 2026, providing investors with the latest insights into its performance and outlook.
Read full news article
Setco Automotive Ltd is Rated Sell
Setco Automotive Ltd is rated 'Sell' by MarketsMOJO, with this rating last updated on 30 Mar 2026. However, the analysis and financial metrics discussed below reflect the stock's current position as of 16 May 2026, providing investors with an up-to-date view of the company’s fundamentals, returns, and market standing.
Read full news article Announcements
Disclosures under Reg. 31(1) and 31(2) of SEBI (SAST) Regulations 2011.
22-Jun-2026 | Source : BSEThe Exchange has received Disclosure under Regulation 31(1) and 31(2) of SEBI (Substantial Acquisition of Shares & Takeovers) Regulations 2011 on June 21 2026 for Udit Harish Sheth
Disclosures under Reg. 31(1) and 31(2) of SEBI (SAST) Regulations 2011.
22-Jun-2026 | Source : BSEThe Exchange has received Disclosure under Regulation 31(1) and 31(2) of SEBI (Substantial Acquisition of Shares & Takeovers) Regulations 2011 on June 21 2026 for Setco Engineering Pvt Ltd
Results-Delay in Financial Results
01-Jun-2026 | Source : BSEIntimation regarding delay in submission of audited standalone & consolidated financial results for the quarter/ year end March 31 2026
Corporate Actions

No Upcoming Board Meetings

Setco Automotive Ltd has declared 650% dividend, ex-date: 02 Jun 26

Setco Automotive Ltd has announced 2:10 stock split, ex-date: 16 Dec 15

Setco Automotive Ltd has announced 1:2 bonus issue, ex-date: 14 Aug 12

No Rights history available
Quality key factors
Valuation key factors
Technicals key factors
 Technical Indicator Scale: Bearish, Mildly Bearish, Sideways, Mildly Bullish, Bullish Turned
 Shareholding Snapshot : Mar 2026
Shareholding Compare (%holding)
Promoters
94.5939
Held by 0 Schemes
Held by 1 FIIs (0.03%)
Setco Engineering Pvt Ltd (47.89%)
None
34.02%
Quarterly Results Snapshot (Consolidated) - Dec'25 - YoY

YoY Growth in quarter ended Dec 2025 is 9.26% vs 8.99% in Dec 2024

YoY Growth in quarter ended Dec 2025 is -76.62% vs -18.60% in Dec 2024
Half Yearly Results Snapshot (Consolidated) - Sep'25
Growth in half year ended Sep 2025 is 10.96% vs 10.83% in Sep 2024
Growth in half year ended Sep 2025 is -18.53% vs 10.59% in Sep 2024
Nine Monthly Results Snapshot (Consolidated) - Dec'25
YoY Growth in nine months ended Dec 2025 is 10.35% vs 10.17% in Dec 2024
YoY Growth in nine months ended Dec 2025 is -37.74% vs 2.67% in Dec 2024
Annual Results Snapshot (Consolidated) - Mar'25
YoY Growth in year ended Mar 2025 is 12.17% vs 17.43% in Mar 2024
YoY Growth in year ended Mar 2025 is 6.74% vs 26.09% in Mar 2024
About Setco Automotive Ltd

Company Coordinates


