Setco Automotive

  • Market Cap: Micro Cap
  • Industry: Auto Components & Equipments
  • ISIN: INE878E01021
  • NSEID: SETCO
  • BSEID: 505075
INR
17.18
0.1 (0.59%)
BSENSE

Sep 09, 03:30 PM

BSE+NSE Vol: 91.2 k

  • Price Points
  • Score
  • Mojo Parameters
  • Total Return
  • News and Corporate Actions
  • Key factors
  • Shareholding
  • Financials
  • CompanyCV
stock-summaryPrice Point
High/Low

1Day

52 Week

Valuation
Technical
Day's Volume

CASH

91.2 k (35.30%) Volume

Shareholding (Jun 2026)

FII

0.08%

Held by 1 FIIs

DII

0.00%

Held by 0 DIIs

Promoter

59.25%

Why is Setco Automotive Ltd falling/rising?

06-Sep-2026

As of 05-Sep, Setco Automotive Ltd's stock price is at 17.50, reflecting a 2.23% decrease and a consistent decline over three days. The stock is trading below all major moving averages, indicating a downward trend, while investor participation has also decreased significantly.

As of 05-Sep, Setco Automotive Ltd's stock price is falling, currently at 17.50, which reflects a decrease of 0.4 or 2.23%. The stock has been underperforming, having lost 4.16% over the last three days and has consistently fallen for three consecutive days. Additionally, it is trading below its 5-day, 20-day, 50-day, 100-day, and 200-day moving averages, indicating a downward trend in its price performance.<BR><BR>Investor participation has also declined, with the delivery volume on September 3 dropping by 44.36% compared to the 5-day average, suggesting reduced interest from investors. Although the stock has shown positive year-to-date and one-year returns of 11.18% and 16.12% respectively, the recent performance indicates a struggle against both the sector and broader market trends, as it has underperformed its sector by 2.17% today. Overall, these factors contribute to the current decline in Setco Automotive Ltd's stock price.

View full answer

Who are in the management team of Setco Automotive?

01-Sep-2026

The management team of Setco Automotive includes Harish Sheth (Chairman & Managing Director), Udit Sheth (Executive Vice Chairman), Urja Shah (Executive Director), Hiren P Vala (Company Secretary), and independent directors Arun Arora, Ashok Kumar Jha, and Suhasini Sathe. This team combines executive leadership with independent oversight.

The management team of Setco Automotive includes the following individuals:<BR><BR>1. **Harish Sheth** - Chairman & Managing Director<BR>2. **Udit Sheth** - Executive Vice Chairman<BR>3. **Urja Shah** - Executive Director<BR>4. **Hiren P Vala** - Company Secretary & Compliance Officer<BR>5. **Arun Arora** - Independent Director<BR>6. **Ashok Kumar Jha** - Independent Director<BR>7. **Suhasini Sathe** - Independent Director<BR><BR>This team brings a mix of executive leadership and independent oversight to the company.

View full answer

What does Setco Automotive do?

01-Sep-2026

Setco Automotive Ltd is a micro-cap company specializing in clutch driven plates and clutch cover assemblies, established in 1982. As of December 2025, it reported net sales of 197 Cr and a net loss of 51 Cr, with a market cap of INR 245 Cr.

Overview:<BR>Setco Automotive Ltd is a micro-cap company in the auto components and equipment industry, specializing in the production of clutch driven plates and clutch cover assemblies.<BR><BR>History:<BR>Setco Automotive Ltd was established in 1982, originally named Gujarat Setco Clutch Limited. The company changed its name to Setco Automotive Limited in December 2005. The latest quarterly results reported net sales and profit for December 2025.<BR><BR>Financial Snapshot:<BR>- Net Sales: 197 Cr (Quarterly Results - Dec 2025)<BR>- Net Profit: -51 Cr (Quarterly Results - Dec 2025)<BR>- Market-cap: INR 245 Cr (Micro Cap)<BR><BR>Key Metrics:<BR>- P/E: N/A (Loss Making)<BR>- Industry P/E: 41<BR>- Dividend Yield: 71.42%<BR>- Debt Equity: -1.49<BR>- Return on Equity: 13.92%<BR>- Price to Book: -0.31<BR><BR>Contact Details:<BR>Address: Vadodara-Godhra Highway Kalol, Dist Panchmahals Kalol Gujarat : 389330<BR>Tel: 91-02676-238811<BR>Email: investor.relations@setcoauto.com<BR>Website: http://www.setcoauto.com

View full answer

Who are the peers of the Setco Automotive?

01-Sep-2026

Setco Automotive's peers include Him Teknoforg., Pavna Industries, Bimetal Bearings, Shivam Autotech, Simm. Marshall, Bhagwati Auto, IP Rings, AVATAR Industrie, SKP Bearing, and Sintercom India. Bhagwati Auto has the highest 1-year return at 81.69%, while Pavna Industries has the lowest at -57.07%.

Peers: The peers of Setco Automotive are Him Teknoforg., Pavna Industries, Bimetal Bearings, Shivam Autotech, Simm. Marshall, Bhagwati Auto, IP Rings, AVATAR Industrie, SKP Bearing, and Sintercom India.<BR><BR>Quality Snapshot: Excellent management risk is observed at Bimetal Bearings, while Average management risk is found at Bhagwati Auto and SKP Bearing, and the rest have Below Average management risk. Growth is Good at Simm. Marshall, Average at Bhagwati Auto and Bimetal Bearings, and the rest have Below Average growth. Capital Structure is Excellent at Bimetal Bearings, Good at Bhagwati Auto, and the rest have Below Average capital structure.<BR><BR>Return Snapshot: The peer with the highest 1-year return is Bhagwati Auto at 81.69%, while the peer with the lowest is Pavna Industries at -57.07%. Setco Automotive's own 1-year return is 10.28%, which is higher than Pavna Industries but lower than Bhagwati Auto. Additionally, the peers with negative six-month returns include Pavna Industries, Shivam Autotech, and Simm. Marshall.

View full answer

How big is Setco Automotive?

01-Sep-2026

As of 31st August, Setco Automotive Ltd has a market capitalization of 245.00 Cr and reported net sales of 764.94 Cr with a net loss of 130.54 Cr over the latest four quarters.

As of 31st August, Setco Automotive Ltd has a market capitalization of 245.00 Cr, categorizing it as a Micro Cap company.<BR><BR>In the latest four quarters, Setco Automotive reported net sales of 764.94 Cr. However, the company experienced a net loss of 130.54 Cr during this period.<BR><BR>The latest annual period for the balance sheet is March 2025. At that time, the shareholder's funds were recorded at a loss of 693.82 Cr, while total assets amounted to 558.97 Cr.

View full answer

Should I buy, sell or hold Setco Automotive Ltd?

01-Sep-2026

When is the next results date for Setco Automotive Ltd?

28-Aug-2026

The next results date for Setco Automotive Ltd is 31 August 2026.

The next results date for Setco Automotive Ltd is scheduled for 31 August 2026.

View full answer

How has been the historical performance of Setco Automotive?

01-Dec-2025

Setco Automotive's net sales increased to 718.63 Cr in Mar'25, but the company reported a profit after tax of -126.33 Cr, despite improved operating profit margins of 15.19%. Total liabilities rose to 1,115.56 Cr, while cash flow from operations improved to 89.00 Cr.

Answer:<BR>Setco Automotive has shown a fluctuating financial performance over the years, with net sales increasing from 359.26 Cr in Mar'21 to 718.63 Cr in Mar'25. However, the company has faced significant challenges, as evidenced by its consistent losses, with a profit after tax of -126.33 Cr in Mar'25, improving slightly from -135.14 Cr in Mar'24. The operating profit margin has improved to 15.19% in Mar'25 from -3.65% in Mar'22, indicating a recovery in operational efficiency. Despite this, the gross profit margin remains negative at -13.51% in Mar'25. The company's total liabilities have increased to 1,115.56 Cr in Mar'25, up from 339.44 Cr in Mar'20, reflecting a growing debt burden. Cash flow from operating activities has also improved, reaching 89.00 Cr in Mar'25, compared to -126.00 Cr in Mar'22.<BR><BR>Breakdown:<BR>Setco Automotive's financial trajectory reveals a significant increase in net sales, which rose to 718.63 Cr in Mar'25 from 359.26 Cr in Mar'21, illustrating a strong revenue growth trend. However, the company continues to report substantial losses, with a profit after tax of -126.33 Cr in Mar'25, although this is an improvement from -135.14 Cr in the previous year. The operating profit margin has shown a positive shift, reaching 15.19% in Mar'25, a notable recovery from the negative margins seen in earlier years. Despite these operational improvements, the gross profit margin remains negative at -13.51%, indicating ongoing challenges in cost management. The total liabilities have escalated to 1,115.56 Cr, reflecting a significant increase in debt, while cash flow from operating activities has improved to 89.00 Cr, suggesting a better cash generation capability in the latest fiscal year.

View full answer

Are Setco Automotive latest results good or bad?

18-Nov-2025

Setco Automotive's latest results are concerning, showing a net loss of ₹26.65 crores and ongoing financial distress despite a year-on-year sales growth of 11.99%. The company has been loss-making for seven years, with significant debt and solvency issues.

Setco Automotive's latest results indicate a challenging financial situation. The company reported a consolidated net loss of ₹26.65 crores, which is a significant decline of 23.68% compared to the previous quarter. While net sales showed a positive year-on-year growth of 11.99%, reaching ₹179.01 crores, this growth is overshadowed by the company's ongoing financial distress.<BR><BR>The operating margin improved slightly to 13.54%, reflecting better cost management, but this is not enough to offset the heavy interest burden, which amounted to ₹61.05 crores—more than 2.5 times the operating profit. The company has been loss-making for seven consecutive years, and its long-term debt of ₹1,072.37 crores against negative shareholder equity of ₹693.82 crores raises serious solvency concerns.<BR><BR>Overall, while there are some operational improvements, the financial metrics suggest that Setco Automotive is in a precarious position, making the latest results more indicative of distress rather than success.

View full answer

Who are the top shareholders of the Setco Automotive?

17-Jul-2025

The top shareholders of Setco Automotive include Setco Engineering Private Limited with 47.89%, individual investors with 33.76%, and a foreign institutional investor with 0.07%. Notably, about 94.59% of the promoter holdings are pledged.

The top shareholders of Setco Automotive primarily consist of promoters, with Setco Engineering Private Limited holding the largest share at 47.89%. Additionally, individual investors collectively hold 33.76% of the shares. There is one foreign institutional investor (FII) with a minimal stake of 0.07%, and no mutual funds currently hold shares in the company. It's noteworthy that a significant portion of the promoter holdings, approximately 94.59%, is pledged.

View full answer

Is Setco Automotive overvalued or undervalued?

09-Jun-2025

As of April 25, 2023, Setco Automotive is considered overvalued and risky due to its negative PE ratio of -2.30 and unfavorable financial metrics compared to peers, despite a strong 1-year stock return of 75.61%.

As of 25 April 2023, the valuation grade for Setco Automotive has moved from does not qualify to risky, indicating a significant change in its perceived financial health. The company is currently overvalued based on its negative PE ratio of -2.30 and price to book value of -0.35, which suggest underlying issues with profitability and asset valuation. Additionally, the EV to EBITDA ratio stands at 12.24, which, while not excessively high, does not compensate for the negative earnings indicators.<BR><BR>In comparison to its peers, Setco Automotive's valuation appears unfavorable. For instance, Samvardhana Motherson has a PE ratio of 29.14 and an EV to EBITDA of 11.53, reflecting a more robust financial position. Other peers like Bosch and Uno Minda are categorized as expensive, with PE ratios of 46.21 and 66.72, respectively. Despite a strong 1-year stock return of 75.61%, the overall financial metrics and peer comparisons suggest that Setco Automotive is overvalued in the current market context.

View full answer

What is the technical trend for Setco Automotive?

09-Jun-2025

As of June 2, 2025, Setco Automotive's trend is mildly bullish, supported by daily moving averages, despite mixed signals from the weekly MACD and Bollinger Bands indicating caution.

As of 2 June 2025, the technical trend for Setco Automotive has changed from bullish to mildly bullish. The weekly MACD indicates a mildly bearish stance, while the monthly MACD remains bullish. The daily moving averages are mildly bullish, supporting the overall mildly bullish trend. However, the weekly Bollinger Bands are bearish, which adds some caution. The KST shows a mildly bearish signal on the weekly chart but is bullish on the monthly. Overall, the strength of the trend is moderate, influenced by mixed signals across different time frames.

View full answer

What is the bonus history of the Setco Automotive?

06-Jun-2025

Setco Automotive has issued bonuses twice: a 1:2 bonus on August 14, 2012, and a 1:1 bonus on August 5, 2010, reflecting the company's commitment to rewarding shareholders.

Setco Automotive has a history of bonus issues that includes two notable instances. The most recent bonus was a 1:2 bonus issue announced with an ex-date of August 14, 2012, and a record date of August 17, 2012. Prior to that, the company issued a 1:1 bonus with an ex-date of August 5, 2010, and a record date of August 9, 2010. This indicates a commitment to rewarding shareholders through bonus shares in the past.

View full answer

Has Setco Automotive declared dividend?

06-Jun-2025

Setco Automotive Ltd has declared a 50% dividend, amounting to ₹1 per share, with an ex-date of September 19, 2019. However, the dividend yield is 0%, indicating that returns are primarily from price appreciation, with significant total returns of 72.34% over the past year and 143.05% over the past two years.

Setco Automotive Ltd has declared a 50% dividend.<BR><BR>Dividend Details:<BR>- Percentage announced: 50%<BR>- Amount per share: 1 per share<BR>- Ex-date: 19 Sep 19<BR><BR>Dividend Yield: 0%<BR><BR>Total Returns by Period:<BR>In the 6-month period, the price return was 31.94%, with a dividend return of 0%, resulting in a total return of 31.94%.<BR><BR>For the 1-year period, the price return was 72.34%, with a dividend return of 0%, leading to a total return of 72.34%.<BR><BR>Over the 2-year period, the price return was 143.05%, with a dividend return of 0%, yielding a total return of 143.05%.<BR><BR>In the 3-year period, the price return was 28.46%, with a dividend return of 0%, resulting in a total return of 28.46%.<BR><BR>For the 4-year period, the price return was -10.17%, with a dividend return of 0%, leading to a total return of -10.17%.<BR><BR>In the 5-year period, the price return was 59.95%, with a dividend return of 0%, yielding a total return of 59.95%.<BR><BR>Overall, Setco Automotive has declared a dividend, but the dividend yield remains at 0%, indicating that the returns are primarily driven by price appreciation rather than dividend income. The total returns over various periods show significant price growth, particularly in the 1 and 2-year periods.

View full answer
iScoreScore
Click here to find our call on this stock
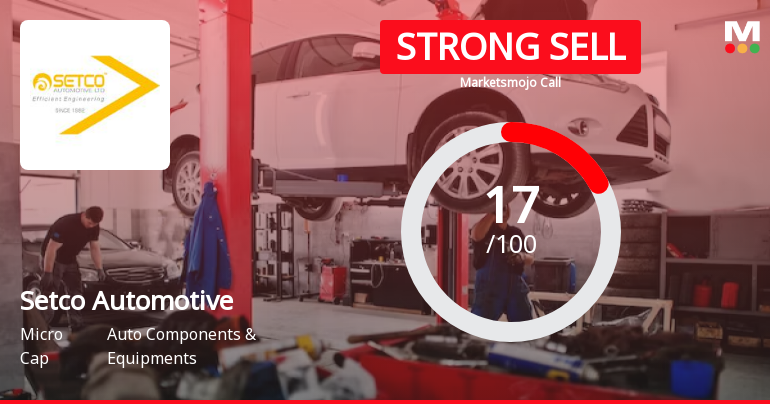
Strong Sell
Sell
Hold
Buy
Strong Buy

Dashboard

1

With a Negative Book Value, the company has a Weak Long Term Fundamental Strength

  • Poor long term growth as Net Sales has grown by an annual rate of 17.51% and Operating profit at -163.25% over the last 5 years
  • The company has a negative book value of Rs 708.17 crore
2

Flat results in Dec 25

3

Risky - Negative Book Value

4

71.28% of Promoter Shares are Pledged

stock-summaryMojo Parameters

Mojo Parameters

Loading Valuation Snapshot...

Stock DNA

stock-summary
Industry

Auto Components & Equipments

stock-summary
Market cap

INR 237 Cr (Micro Cap)

stock-summary
P/E

12.00

stock-summary
Industry P/E

40

stock-summary
Dividend Yield

74.19%

stock-summary
Debt Equity

-1.45

stock-summary
Return on Equity

-2.61%

stock-summary
Price to Book

-0.33

Revenue and Profits:
Net Sales:
251 Cr
(Quarterly Results - Mar 2026)
Net Profit:
119 Cr
stock-summaryTotal Returns
Total Returns (Price + Dividend) stock-summary
Dividend Yield (74.19%)
TimePeriod
Price Return
Dividend Return
Total Return
3 Months
-2.16%
0%
-2.16%
6 Months
-3.54%
73.91%
70.37%
1 Year
16.08%
82.64%
98.72%
2 Years
39.11%
107.88%
146.99%
3 Years
130.6%
181.82%
312.42%
4 Years
33.18%
110.64%
143.82%
5 Years
-22.79%
65.99%
43.2%

Latest dividend: 13 per share ex-dividend date: Jun-02-2026

Risk Adjusted Returns v/s stock-summary
Returns Beta
Icon
Beta has not been calculated since enough price history is not available
stock-summaryNews & Corporate Actions

Announcements stock-summary

Setco Automotive Limited - Credit Rating

26-Nov-2019 | Source : NSE

Setco Automotive Limited has informed the Exchange regarding Credit Rating

Setco Automotive Limited - Outcome of Board Meeting

15-Nov-2019 | Source : NSE

Setco Automotive Limited has informed the Exchange regarding Board meeting held on November 14, 2019.

Updates

16-Sep-2019 | Source : NSE

Setco Automotive Limited has informed the Exchange regarding 'With respect to the captioned subject, please be informed that, the Company has received disclosure under regulation 7(2) of Securities and Exchange Board of India (Prohibition of Insider Trading) Regulations, 2015 from Ms. Suhasini Somesh Sathe for acquisition of 5,000 Equity Shares of Rs. 2/- each representing 0.00% of the paid-up capital of the Company by way of market purchase. In terms of the Securities and Exchange Board of India (Prohibition of Insider Trading) Regulations, 2015, we enclose Form C under regulation 7(2) of Securities and Exchange Board of India (Prohibition of Insider Trading) Regulations, 2015, in the specified format.'.

Corporate Actions stock-summary

stock-summary
BOARD MEETING

No Upcoming Board Meetings

stock-summary
DIVIDEND

Setco Automotive Ltd has declared 650% dividend, ex-date: 02 Jun 26

stock-summary
SPLITS

Setco Automotive Ltd has announced 2:10 stock split, ex-date: 16 Dec 15

stock-summary
BONUS

Setco Automotive Ltd has announced 1:2 bonus issue, ex-date: 14 Aug 12

stock-summary
RIGHTS

No Rights history available

stock-summaryKey Factors

Quality key factors stock-summary

Factor
Value
Sales Growth (5y)
17.51%
EBIT Growth (5y)
28.95%
EBIT to Interest (avg)
0.36
Debt to EBITDA (avg)
Negative Net Debt
Net Debt to Equity (avg)
-1.45
Sales to Capital Employed (avg)
1.38
Tax Ratio
10.18%
Dividend Payout Ratio
0
Pledged Shares
71.28%
Institutional Holding
0.09%
ROCE (avg)
5.10%
ROE (avg)
0

Valuation key factors

Factor
Value
P/E Ratio
12
Industry P/E
40
Price to Book Value
-0.33
EV to EBIT
18.40
EV to EBITDA
12.91
EV to Capital Employed
3.92
EV to Sales
1.57
PEG Ratio
0.11
Dividend Yield
75.35%
ROCE (Latest)
21.28%
ROE (Latest)
Negative BV

Technicals key factors

Indicator
Weekly
Monthly
MACD
Bearish
Mildly Bearish
RSI
No Signal
No Signal
Bollinger Bands
Bearish
Bearish
Moving Averages
Bearish (Daily)
KST
Bearish
Mildly Bearish
Dow Theory
Mildly Bearish
Mildly Bullish
OBV
Mildly Bearish
Bullish
stock-summary Technical Indicator Scale: Bearish, Mildly Bearish, Sideways, Mildly Bullish, Bullish  Turned 
stock-summaryShareholding
Shareholding Snapshot : Jun 2026stock-summary
Shareholding Compare (%holding) stock-summary
Majority shareholders

Promoters

Pledged Promoter Holdings

71.2758

Mutual Funds

Held by 0 Schemes

FIIs

Held by 1 FIIs (0.08%)

Promoter with highest holding

Setco Engineering Pvt Ltd (47.89%)

Highest Public shareholder

Bharat C Jain (2.24%)

Individual Investors Holdings

34.46%

stock-summaryFinancial
[
  {
    "link": "quarterly",
    "btn_text": "All Quarterly Results",
    "header": "Quarterly Results Snapshot (Consolidated) - Mar'26 - YoY",
    "rhs": [
      {
        "prefix": "Net Sales ",
        "suffix": "YoY Growth in quarter ended Mar 2026 is 18.99% vs 19.02% in Mar 2025",
        "dir": -1
      },
      {
        "prefix": "Consolidated Net Profit ",
        "suffix": "YoY Growth in quarter ended Mar 2026 is 753.39% vs 22.21% in Mar 2025",
        "dir": 1
      }
    ],
    "table": {
      "header": [
        "Mar'26",
        "Mar'25",
        "Change(%)"
      ],
      "body": [
        {
          "field": "Net Sales",
          "val1": "250.63",
          "val2": "210.63",
          "chgp": "18.99%",
          "chgp_class": "positive"
        },
        {
          "field": "Operating Profit (PBDIT) excl Other Income",
          "val1": "22.97",
          "val2": "40.60",
          "chgp": "-43.42%",
          "chgp_class": "negative"
        },
        {
          "field": "Interest",
          "val1": "-125.35",
          "val2": "58.10",
          "chgp": "-315.75%",
          "chgp_class": "positive"
        },
        {
          "field": "Exceptional Items",
          "val1": "-11.36",
          "val2": "0.00",
          "chgp": "",
          "chgp_class": "neutral"
        },
        {
          "field": "Consolidate Net Profit",
          "val1": "119.44",
          "val2": "-18.28",
          "chgp": "753.39%",
          "chgp_class": "positive"
        },
        {
          "field": "Operating Profit Margin (Excl OI)",
          "val1": "9.16%",
          "val2": "19.28%",
          "chgp": "-10.12%",
          "chgp_class": "negative"
        }
      ]
    }
  },
  {
    "link": "half-yearly",
    "btn_text": "All Half Yearly Results",
    "header": "Half Yearly Results Snapshot (Consolidated) - Sep'25",
    "rhs": [
      {
        "prefix": "Net Sales ",
        "suffix": " Growth in half year ended Sep 2025 is 10.96% vs 10.83% in Sep 2024",
        "dir": 1
      },
      {
        "prefix": "Consolidated Net Profit ",
        "suffix": " Growth in half year ended Sep 2025 is -18.53% vs 10.59% in Sep 2024",
        "dir": -1
      }
    ],
    "table": {
      "header": [
        "Sep'25",
        "Sep'24",
        "Change(%)"
      ],
      "body": [
        {
          "field": "Net Sales",
          "val1": "357.76",
          "val2": "322.43",
          "chgp": "10.96%",
          "chgp_class": "positive"
        },
        {
          "field": "Operating Profit (PBDIT) excl Other Income",
          "val1": "45.81",
          "val2": "39.15",
          "chgp": "17.01%",
          "chgp_class": "positive"
        },
        {
          "field": "Interest",
          "val1": "118.99",
          "val2": "101.90",
          "chgp": "16.77%",
          "chgp_class": "negative"
        },
        {
          "field": "Exceptional Items",
          "val1": "0.00",
          "val2": "-0.56",
          "chgp": "100.00%",
          "chgp_class": "positive"
        },
        {
          "field": "Consolidate Net Profit",
          "val1": "-68.88",
          "val2": "-58.11",
          "chgp": "-18.53%",
          "chgp_class": "negative"
        },
        {
          "field": "Operating Profit Margin (Excl OI)",
          "val1": "12.80%",
          "val2": "12.14%",
          "chgp": "0.66%",
          "chgp_class": "positive"
        }
      ]
    }
  },
  {
    "link": "nine-monthly",
    "btn_text": "All Nine Monthly Results",
    "header": "Nine Monthly Results Snapshot (Consolidated) - Dec'25",
    "rhs": [
      {
        "prefix": "Net Sales ",
        "suffix": "YoY Growth in nine months ended Dec 2025 is 10.35% vs 10.17% in Dec 2024",
        "dir": 1
      },
      {
        "prefix": "Consolidated Net Profit ",
        "suffix": "YoY Growth in nine months ended Dec 2025 is -37.74% vs 2.67% in Dec 2024",
        "dir": -1
      }
    ],
    "table": {
      "header": [
        "Dec'25",
        "Dec'24",
        "Change(%)"
      ],
      "body": [
        {
          "field": "Net Sales",
          "val1": "554.31",
          "val2": "502.32",
          "chgp": "10.35%",
          "chgp_class": "positive"
        },
        {
          "field": "Operating Profit (PBDIT) excl Other Income",
          "val1": "74.68",
          "val2": "68.56",
          "chgp": "8.93%",
          "chgp_class": "positive"
        },
        {
          "field": "Interest",
          "val1": "181.14",
          "val2": "159.31",
          "chgp": "13.70%",
          "chgp_class": "negative"
        },
        {
          "field": "Exceptional Items",
          "val1": "0.00",
          "val2": "-0.56",
          "chgp": "100.00%",
          "chgp_class": "positive"
        },
        {
          "field": "Consolidate Net Profit",
          "val1": "-119.57",
          "val2": "-86.81",
          "chgp": "-37.74%",
          "chgp_class": "negative"
        },
        {
          "field": "Operating Profit Margin (Excl OI)",
          "val1": "13.47%",
          "val2": "13.65%",
          "chgp": "-0.18%",
          "chgp_class": "negative"
        }
      ]
    }
  },
  {
    "link": "annual",
    "btn_text": "All Annual Results",
    "header": "Annual Results Snapshot (Consolidated) - Mar'26",
    "rhs": [
      {
        "prefix": "Net Sales ",
        "suffix": "YoY Growth in year ended Mar 2026 is 12.01% vs 12.17% in Mar 2025",
        "dir": -1
      },
      {
        "prefix": "Consolidated Net Profit ",
        "suffix": "YoY Growth in year ended Mar 2026 is 99.89% vs 6.74% in Mar 2025",
        "dir": 1
      }
    ],
    "table": {
      "header": [
        "Mar'26",
        "Mar'25",
        "Change(%)"
      ],
      "body": [
        {
          "field": "Net Sales",
          "val1": "804.93",
          "val2": "718.63",
          "chgp": "12.01%",
          "chgp_class": "positive"
        },
        {
          "field": "Operating Profit (PBDIT) excl Other Income",
          "val1": "97.65",
          "val2": "109.18",
          "chgp": "-10.56%",
          "chgp_class": "negative"
        },
        {
          "field": "Interest",
          "val1": "55.79",
          "val2": "217.41",
          "chgp": "-74.34%",
          "chgp_class": "positive"
        },
        {
          "field": "Exceptional Items",
          "val1": "-11.36",
          "val2": "-0.57",
          "chgp": "-1,892.98%",
          "chgp_class": "negative"
        },
        {
          "field": "Consolidate Net Profit",
          "val1": "-0.12",
          "val2": "-105.09",
          "chgp": "99.89%",
          "chgp_class": "positive"
        },
        {
          "field": "Operating Profit Margin (Excl OI)",
          "val1": "12.13%",
          "val2": "15.19%",
          "chgp": "-3.06%",
          "chgp_class": "negative"
        }
      ]
    }
  }
]

Quarterly Results Snapshot (Consolidated) - Mar'26 - YoYstock-summary

Mar'26
Mar'25
Change(%)
Net Sales
250.63
210.63
18.99%
Operating Profit (PBDIT) excl Other Income
22.97
40.60
-43.42%
Interest
-125.35
58.10
-315.75%
Exceptional Items
-11.36
0.00
Consolidate Net Profit
119.44
-18.28
753.39%
Operating Profit Margin (Excl OI)
9.16%
19.28%
-10.12%
Values in Rs Cr.
Direction Arrows
Net Sales

YoY Growth in quarter ended Mar 2026 is 18.99% vs 19.02% in Mar 2025

Direction Arrows
Consolidated Net Profit

YoY Growth in quarter ended Mar 2026 is 753.39% vs 22.21% in Mar 2025

Half Yearly Results Snapshot (Consolidated) - Sep'25stock-summary

Sep'25
Sep'24
Change(%)
Net Sales
357.76
322.43
10.96%
Operating Profit (PBDIT) excl Other Income
45.81
39.15
17.01%
Interest
118.99
101.90
16.77%
Exceptional Items
0.00
-0.56
100.00%
Consolidate Net Profit
-68.88
-58.11
-18.53%
Operating Profit Margin (Excl OI)
12.80%
12.14%
0.66%
Values in Rs Cr.
Direction Arrows
Net Sales

Growth in half year ended Sep 2025 is 10.96% vs 10.83% in Sep 2024

Direction Arrows
Consolidated Net Profit

Growth in half year ended Sep 2025 is -18.53% vs 10.59% in Sep 2024

Nine Monthly Results Snapshot (Consolidated) - Dec'25stock-summary

Dec'25
Dec'24
Change(%)
Net Sales
554.31
502.32
10.35%
Operating Profit (PBDIT) excl Other Income
74.68
68.56
8.93%
Interest
181.14
159.31
13.70%
Exceptional Items
0.00
-0.56
100.00%
Consolidate Net Profit
-119.57
-86.81
-37.74%
Operating Profit Margin (Excl OI)
13.47%
13.65%
-0.18%
Values in Rs Cr.
Direction Arrows
Net Sales

YoY Growth in nine months ended Dec 2025 is 10.35% vs 10.17% in Dec 2024

Direction Arrows
Consolidated Net Profit

YoY Growth in nine months ended Dec 2025 is -37.74% vs 2.67% in Dec 2024

Annual Results Snapshot (Consolidated) - Mar'26stock-summary

Mar'26
Mar'25
Change(%)
Net Sales
804.93
718.63
12.01%
Operating Profit (PBDIT) excl Other Income
97.65
109.18
-10.56%
Interest
55.79
217.41
-74.34%
Exceptional Items
-11.36
-0.57
-1,892.98%
Consolidate Net Profit
-0.12
-105.09
99.89%
Operating Profit Margin (Excl OI)
12.13%
15.19%
-3.06%
Values in Rs Cr.
Direction Arrows
Net Sales

YoY Growth in year ended Mar 2026 is 12.01% vs 12.17% in Mar 2025

Direction Arrows
Consolidated Net Profit

YoY Growth in year ended Mar 2026 is 99.89% vs 6.74% in Mar 2025

stock-summaryCompany CV
About Setco Automotive Ltd stock-summary
stock-summary
Setco Automotive Ltd
Micro Cap
Auto Components & Equipments
Setco Automotive Limited, formerly known Gujarat Setco Clutch Limited established in 1982, produces clutch driven plate and clutch cover assemblies. The name of the Company was changed from Gujarat Setco Clutch Limited to Setco Automotive Limited in Decmeber, 2005. The Company is engaged in manufacturing of Clutch products and systems and Hydraulics (Pressure Converters). The Company is having 4 manufacturing units i.e. 2 in India and 1 each in United Kingdom and United States of America.
Company Coordinates stock-summary
Company Details
Vadodara-Godhra Highway Kalol, Dist Panchmahals Kalol Gujarat : 389330
stock-summary
Tel: 91-02676-238811
stock-summary
investor.relations@setcoauto.com
Registrar Details
Link Intime India Pvt Ltd, C-13 Pannalal Silk Compound, L B S Marg, Bhandup , Mumbai