
Compare Sh. Ganesh Elas. with Similar Stocks
Stock DNA
Trading & Distributors
INR 11 Cr (Micro Cap)
NA (Loss Making)
NA
0.00%
-0.05
-11.63%
2.62
Total Returns (Price + Dividend) 
Sh. Ganesh Elas. for the last several years.
Risk Adjusted Returns v/s
Returns Beta

News
Shree Ganesh Elastoplast Q4 FY26: Profit Recovery Masks Deeper Structural Concerns
Shree Ganesh Elastoplast Ltd., a micro-cap trading company specialising in agricultural commodities, posted a marginal profit of ₹0.04 crores in Q4 FY26 (Mar'26), marking a sharp reversal from the ₹0.32 crore loss reported in Q3 FY26 (Dec'25). However, this represents a dramatic 97.81% year-on-year decline from the ₹1.83 crore loss in Q4 FY25, though the company had turned profitable on an absolute basis. With a market capitalisation of just ₹10.00 crores and trading at ₹18.95, the stock reflects heightened investor caution amid persistent operational volatility and weak fundamental strength.
Read full news articleAre Shree Ganesh Elastoplast Ltd latest results good or bad?
Shree Ganesh Elastoplast Ltd's latest financial results for Q3 FY26 highlight significant operational challenges. The company reported net sales of ₹1.32 crores, reflecting a year-on-year decline of 27.07%, despite a sequential growth of 97.01% from the previous quarter. This suggests that while there was a recovery from a low base, overall revenue remains substantially below prior year levels, indicating potential issues in market share and operational stability. The operating losses widened to ₹0.30 crores, resulting in a negative operating margin of 22.73%. This marks a deterioration from the previous quarter's margin, which was already negative, pointing to ongoing operational inefficiencies. The profit after tax margin was also negative at -24.24%, further underscoring the company's profitability crisis. Over the trailing nine months of FY26, Shree Ganesh Elastoplast generated total revenue of ₹2.26 ...
Read full news article Announcements
Share Purchase Disclosure
30-Jun-2026 | Source : BSEShare Purchase Disclosure
Closure of Trading Window
30-Jun-2026 | Source : BSEClosure of Trading Window
Declaration Under Regulation 29(2) For Aquasition Of Shares
26-Jun-2026 | Source : BSEDeclaration Under Regulation 29(2) For Aquasition of Shares
Corporate Actions

No Upcoming Board Meetings

No Dividend history available

No Splits history available

No Bonus history available

No Rights history available
Quality key factors
Valuation key factors
Technicals key factors
 Technical Indicator Scale: Bearish, Mildly Bearish, Sideways, Mildly Bullish, Bullish Turned
 Shareholding Snapshot : Mar 2026
Shareholding Compare (%holding)
Non Institution
None
Held by 1 Schemes (0.09%)
Held by 0 FIIs
Devdas N Sheth (5.68%)
Merry Share Fin Limited (11.57%)
64.13%
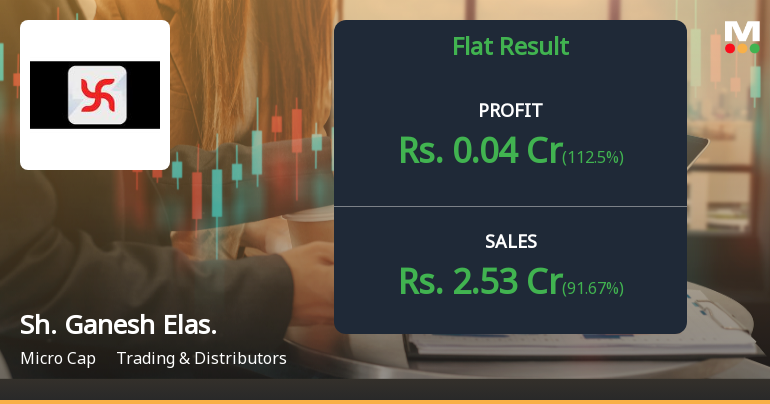
Quarterly Results Snapshot (Standalone) - Mar'26 - QoQ

QoQ Growth in quarter ended Mar 2026 is 91.67% vs 97.01% in Dec 2025

QoQ Growth in quarter ended Mar 2026 is 112.50% vs -10.34% in Dec 2025
Half Yearly Results Snapshot (Standalone) - Sep'25
Growth in half year ended Sep 2025 is -94.30% vs 91.85% in Sep 2024
Growth in half year ended Sep 2025 is -113.25% vs 27.97% in Sep 2024
Nine Monthly Results Snapshot (Standalone) - Dec'25
YoY Growth in nine months ended Dec 2025 is -87.64% vs 19.39% in Dec 2024
YoY Growth in nine months ended Dec 2025 is -244.44% vs -86.15% in Dec 2024
Annual Results Snapshot (Standalone) - Mar'26
YoY Growth in year ended Mar 2026 is -75.72% vs -16.29% in Mar 2025
YoY Growth in year ended Mar 2026 is 67.35% vs -190.18% in Mar 2025
About Shree Ganesh Elastoplast Ltd

Company Coordinates


