
Compare Shah Metacorp with Similar Stocks
Dashboard
With a Operating Losses, the company has a Weak Long Term Fundamental Strength
- Poor long term growth as Operating profit has grown by an annual rate 14.55% of over the last 5 years
- Low ability to service debt as the company has a high Debt to EBITDA ratio of 135.07 times
Flat results in Mar 26
Risky - Negative Operating Profits
Stock DNA
Iron & Steel Products
INR 367 Cr (Micro Cap)
32.00
24
0.00%
0.78
3.99%
1.21
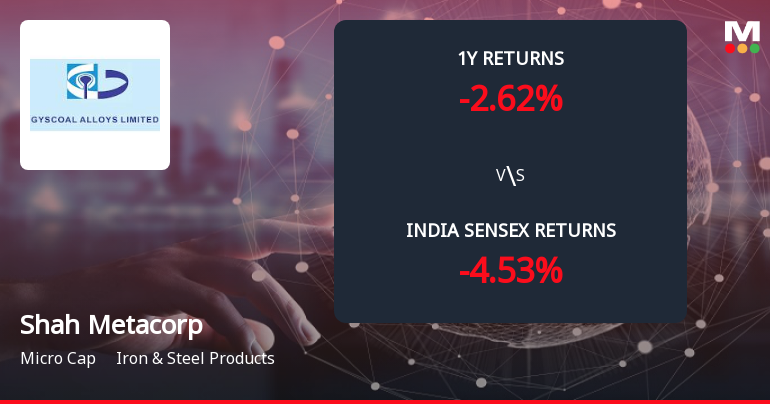
Total Returns (Price + Dividend) 
Shah Metacorp for the last several years.
Risk Adjusted Returns v/s
Returns Beta

News
Shah Metacorp Ltd Forms Death Cross, Signalling Potential Bearish Trend
Shah Metacorp Ltd, a micro-cap player in the Iron & Steel Products sector, has recently formed a Death Cross—a technical pattern where the 50-day moving average crosses below the 200-day moving average—indicating a potential shift towards a sustained bearish trend. This development comes amid deteriorating price momentum and weak technical indicators, raising concerns about the stock’s near- and long-term outlook.
Read full news article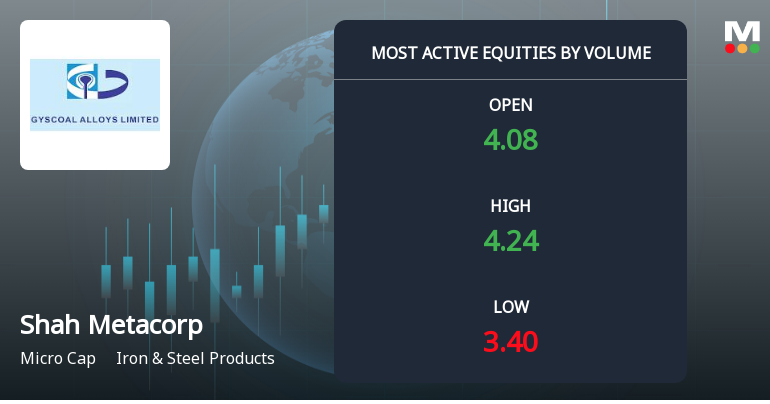
Shah Metacorp Ltd Sees Exceptional Volume Amid Sharp Price Decline
Shah Metacorp Ltd, a micro-cap player in the Iron & Steel Products sector, witnessed extraordinary trading volumes on 29 Jul 2026, even as its share price plunged sharply. The stock’s heavy volume activity, combined with a significant price drop, signals strong distribution pressure and heightened investor caution amid a deteriorating outlook.
Read full news article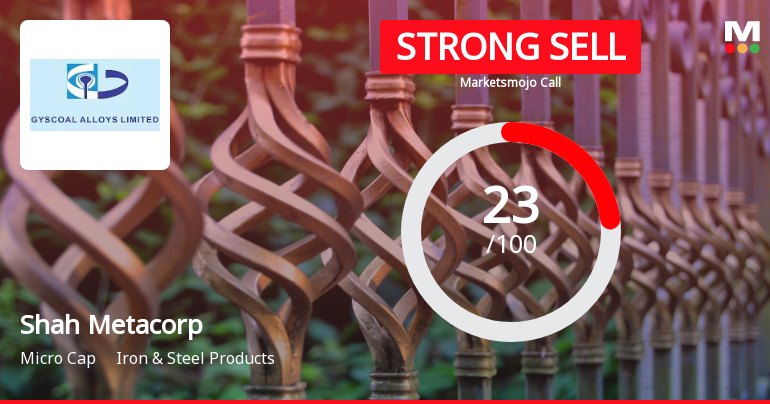
Shah Metacorp Ltd Downgraded to Strong Sell Amid Technical and Financial Weaknesses
Shah Metacorp Ltd, a micro-cap player in the Iron & Steel Products sector, has seen its investment rating downgraded from Sell to Strong Sell as of 24 July 2026. This shift reflects deteriorating technical indicators, flat financial performance, and weak long-term fundamentals, despite the stock’s recent market-beating returns. The downgrade highlights growing concerns over valuation, financial health, and technical trends that investors should carefully consider.
Read full news article Announcements
Disclosures under Reg. 29(2) of SEBI (SAST) Regulations 2011
18-Jul-2026 | Source : BSEThe Exchange has received the disclosure under Regulation 29(2) of SEBI (Substantial Acquisition of Shares & Takeovers) Regulations 2011 for Mona Viral Shah
Announcement under Regulation 30 (LODR)-Allotment
16-Jul-2026 | Source : BSEApproved Allotment of 10000000 (One Crore) equity shares pursuant to exercise of right attached to convertible warrants out of total issued 20000000 convertible warrants into equity shares to Ms. Mona Viral Shah- Promoter and Director at an issue price of Rs. 4.71 per share [Rs. 1/- face value + Rs. 3.71/- premium per share] on June 28 2025. The Company has received conversion request letter from Ms. Mona Shah for allotment of 10000000 equity shares. Accordingly the Company has allotted 10000000 (One Crore) equity shares of Rs. 1/- each to the Ms. Mona Viral Shah - Promoter and Director upon conversion of warrant. Further the Warrant Holders have paid the balance of the consideration aggregating to Rs. 35325000/-
Announcement under Regulation 30 (LODR)-Change in Management
16-Jul-2026 | Source : BSEas per enclosure
Corporate Actions

No Upcoming Board Meetings

No Dividend history available

Shah Metacorp Ltd has announced 1:10 stock split, ex-date: 13 Oct 16

No Bonus history available

Shah Metacorp Ltd has announced 36:311 rights issue, ex-date: 27 May 26
Quality key factors
Valuation key factors
Technicals key factors
 Technical Indicator Scale: Bearish, Mildly Bearish, Sideways, Mildly Bullish, Bullish Turned
 Shareholding Snapshot : Jul 2026
Shareholding Compare (%holding)
Non Institution
None
Held by 0 Schemes
Held by 3 FIIs (1.08%)
Mona Viral Shah (14.94%)
Shah Malavkumar Kalpesh (15.13%)
43.56%
Quarterly Results Snapshot (Consolidated) - Mar'26 - QoQ

QoQ Growth in quarter ended Mar 2026 is 24.46% vs -25.06% in Dec 2025
QoQ Growth in quarter ended Mar 2026 is 1,101.45% vs -2.82% in Dec 2025
Half Yearly Results Snapshot (Consolidated) - Sep'25

Growth in half year ended Sep 2025 is 0.89% vs 152.34% in Sep 2024
Growth in half year ended Sep 2025 is -87.60% vs 1,183.58% in Sep 2024
Nine Monthly Results Snapshot (Consolidated) - Dec'25
YoY Growth in nine months ended Dec 2025 is 8.18% vs 166.77% in Dec 2024
YoY Growth in nine months ended Dec 2025 is -86.49% vs 935.97% in Dec 2024
Annual Results Snapshot (Consolidated) - Mar'26
YoY Growth in year ended Mar 2026 is 18.07% vs 91.75% in Mar 2025
YoY Growth in year ended Mar 2026 is -62.67% vs 42.30% in Mar 2025
About Shah Metacorp Ltd

Company Coordinates


