
Compare Shah Metacorp with Similar Stocks
Dashboard
With a Operating Losses, the company has a Weak Long Term Fundamental Strength
- Poor long term growth as Operating profit has grown by an annual rate 14.55% of over the last 5 years
- Low ability to service debt as the company has a high Debt to EBITDA ratio of 135.07 times
Flat results in Mar 26
Risky - Negative Operating Profits
Stock DNA
Iron & Steel Products
INR 455 Cr (Micro Cap)
37.00
26
0.00%
0.78
3.99%
1.48
Total Returns (Price + Dividend) 
Shah Metacorp for the last several years.
Risk Adjusted Returns v/s
Returns Beta

News
Shah Metacorp Ltd is Rated Sell
Shah Metacorp Ltd is rated 'Sell' by MarketsMOJO, with this rating last updated on 02 July 2026. However, the analysis and financial metrics discussed here reflect the stock's current position as of 14 July 2026, providing investors with an up-to-date view of the company’s fundamentals, valuation, financial trends, and technical outlook.
Read full news article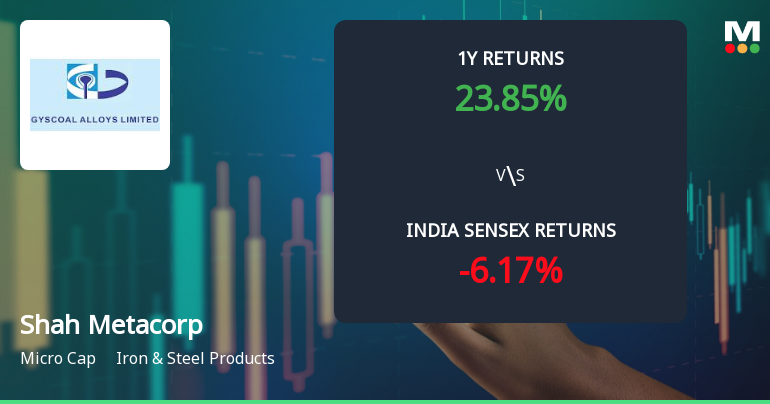
Shah Metacorp Ltd Sees Bullish Momentum Amid Technical Parameter Shift
Shah Metacorp Ltd, a micro-cap player in the Iron & Steel Products sector, has exhibited a notable shift in price momentum, moving from a mildly bullish to a bullish technical trend. Despite a mixed bag of indicator signals, the stock’s recent 4.29% daily gain and strong weekly returns highlight renewed investor interest, contrasting with broader market trends.
Read full news article
Shah Metacorp Ltd Upgraded to Sell on Technical Improvements Despite Weak Fundamentals
Shah Metacorp Ltd, a micro-cap player in the Iron & Steel Products sector, has seen its investment rating upgraded from Strong Sell to Sell as of 2 July 2026. This change reflects a nuanced shift in the company’s technical outlook amid persistent fundamental challenges, prompting a reassessment of its risk and return profile by market analysts.
Read full news article Announcements
Gyscoal Alloys Limited - Updates
05-Dec-2019 | Source : NSEGyscoal Alloys Limited has informed the Exchange regarding 'Disclosure Of Related Party Transaction For The Half Year Ended March 31, 2019.'.
Gyscoal Alloys Limited - Updates
15-Nov-2019 | Source : NSEGyscoal Alloys Limited has informed the Exchange regarding ' Newspaper advertisement
Gyscoal Alloys Limited - Outcome of Board Meeting
13-Nov-2019 | Source : NSEGyscoal Alloys Limited has informed the Exchange regarding outcome of Board meeting held on November 13, 2019.
Corporate Actions

No Upcoming Board Meetings

No Dividend history available

Shah Metacorp Ltd has announced 1:10 stock split, ex-date: 13 Oct 16

No Bonus history available

Shah Metacorp Ltd has announced 36:311 rights issue, ex-date: 27 May 26
Quality key factors
Valuation key factors
Technicals key factors
 Technical Indicator Scale: Bearish, Mildly Bearish, Sideways, Mildly Bullish, Bullish Turned
 Shareholding Snapshot : Jun 2026
Shareholding Compare (%holding)
Non Institution
None
Held by 0 Schemes
Held by 3 FIIs (1.09%)
Mona Viral Shah (14.07%)
Shah Malavkumar Kalpesh (15.28%)
42.16%
Quarterly Results Snapshot (Consolidated) - Mar'26 - QoQ

QoQ Growth in quarter ended Mar 2026 is 24.46% vs -25.06% in Dec 2025
QoQ Growth in quarter ended Mar 2026 is 1,101.45% vs -2.82% in Dec 2025
Half Yearly Results Snapshot (Consolidated) - Sep'25

Growth in half year ended Sep 2025 is 0.89% vs 152.34% in Sep 2024
Growth in half year ended Sep 2025 is -87.60% vs 1,183.58% in Sep 2024
Nine Monthly Results Snapshot (Consolidated) - Dec'25
YoY Growth in nine months ended Dec 2025 is 8.18% vs 166.77% in Dec 2024
YoY Growth in nine months ended Dec 2025 is -86.49% vs 935.97% in Dec 2024
Annual Results Snapshot (Consolidated) - Mar'26
YoY Growth in year ended Mar 2026 is 18.07% vs 91.75% in Mar 2025
YoY Growth in year ended Mar 2026 is -62.67% vs 42.30% in Mar 2025
About Shah Metacorp Ltd

Company Coordinates


