
Compare Shahlon Silk with Similar Stocks
Dashboard
Weak Long Term Fundamental Strength with an average Return on Capital Employed (ROCE) of 8.23%
- Poor long term growth as Net Sales has grown by an annual rate of 3.90% and Operating profit at 19.72% over the last 5 years
- Low ability to service debt as the company has a high Debt to EBITDA ratio of 4.81 times
Flat results in Mar 26
With ROCE of 9, it has a Attractive valuation with a 1.4 Enterprise value to Capital Employed
Majority shareholders : Promoters
Market Beating performance in long term as well as near term
Stock DNA
Garments & Apparels
INR 214 Cr (Micro Cap)
49.00
23
0.25%
1.11
3.91%
1.95
Total Returns (Price + Dividend) 
Latest dividend: 0.06 per share ex-dividend date: Sep-19-2025
Risk Adjusted Returns v/s
Returns Beta

News

Shahlon Silk Industries Ltd is Rated Hold
Shahlon Silk Industries Ltd is rated 'Hold' by MarketsMOJO, with this rating last updated on 08 June 2026. However, the analysis and financial metrics discussed here reflect the company’s current position as of 11 June 2026, providing investors with the latest insights into its performance and outlook.
Read full news article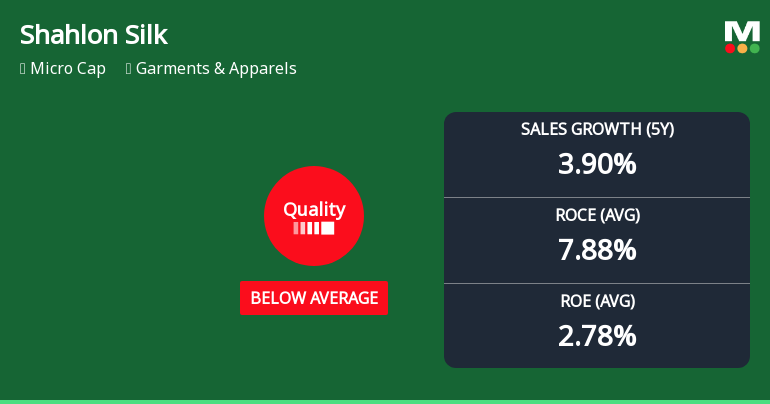
Shahlon Silk Industries Ltd Quality Grade Downgrade Highlights Fundamental Challenges
Shahlon Silk Industries Ltd, a micro-cap player in the Garments & Apparels sector, has seen its quality grade downgraded from average to below average as of 1 June 2026. Despite a respectable year-to-date return of 16.8%, the company’s underlying financial fundamentals reveal a complex picture marked by moderate sales growth, elevated debt levels, and subdued returns on capital. This article analyses the key financial parameters that have influenced this reassessment and what it means for investors.
Read full news article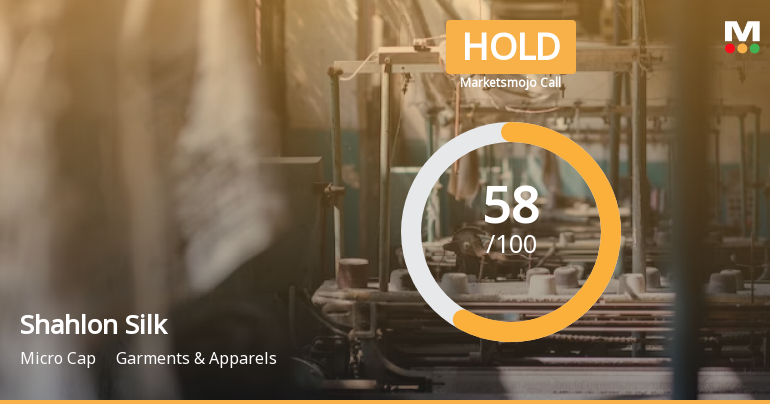
Shahlon Silk Industries Ltd is Rated Hold
Shahlon Silk Industries Ltd is rated 'Hold' by MarketsMOJO, with this rating last updated on 13 Jan 2026. However, the analysis and financial metrics discussed here reflect the company’s current position as of 31 May 2026, providing investors with an up-to-date view of its fundamentals, returns, and market standing.
Read full news article Announcements
Announcement under Regulation 30 (LODR)-Newspaper Publication
30-May-2026 | Source : BSEShahlon Silk Industries Limited has enclosed herewith extract of Newspaper publication relating to audited financial results for the quarter and year ended March 31 2026.
Board Meeting Outcome for For The Meeting Held On May 29 2026
29-May-2026 | Source : BSEOutcome of Board Meeting held on May 29 2026.
Announcement under Regulation 30 (LODR)-Acquisition
29-May-2026 | Source : BSEShahlon Silk Industries Limited has informed exchange regarding Investment to be made in group company namely Karanj Envirocare Private Limited. Detailed disclosure is attached herewith.
Corporate Actions

No Upcoming Board Meetings

Shahlon Silk Industries Ltd has declared 3% dividend, ex-date: 19 Sep 25

Shahlon Silk Industries Ltd has announced 2:10 stock split, ex-date: 11 Nov 21

No Bonus history available

No Rights history available
Quality key factors
Valuation key factors
Technicals key factors
 Technical Indicator Scale: Bearish, Mildly Bearish, Sideways, Mildly Bullish, Bullish Turned
 Shareholding Snapshot : Mar 2026
Shareholding Compare (%holding)
Promoters
None
Held by 0 Schemes
Held by 2 FIIs (0.38%)
Nitin Raichand Shah . (9.61%)
Niveza Small Cap Fund (3.64%)
15.23%
Quarterly Results Snapshot (Standalone) - Mar'26 - QoQ

QoQ Growth in quarter ended Mar 2026 is 60.94% vs -34.09% in Dec 2025

QoQ Growth in quarter ended Mar 2026 is -33.59% vs -15.48% in Dec 2025
Half Yearly Results Snapshot (Standalone) - Sep'25
Growth in half year ended Sep 2025 is 5.66% vs 21.65% in Sep 2024
Growth in half year ended Sep 2025 is 2.73% vs 2.80% in Sep 2024
Nine Monthly Results Snapshot (Standalone) - Dec'25
YoY Growth in nine months ended Dec 2025 is -5.81% vs 37.21% in Dec 2024
YoY Growth in nine months ended Dec 2025 is 12.97% vs 12.46% in Dec 2024
Annual Results Snapshot (Standalone) - Mar'26
YoY Growth in year ended Mar 2026 is 3.30% vs -19.17% in Mar 2025
YoY Growth in year ended Mar 2026 is 27.14% vs -12.06% in Mar 2025
About Shahlon Silk Industries Ltd

Company Coordinates


