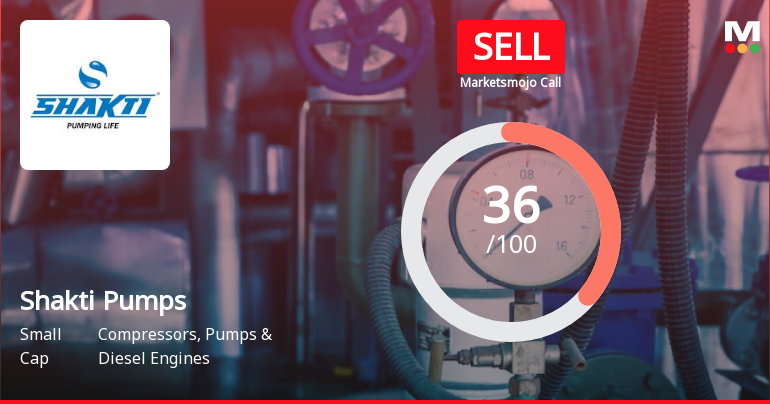
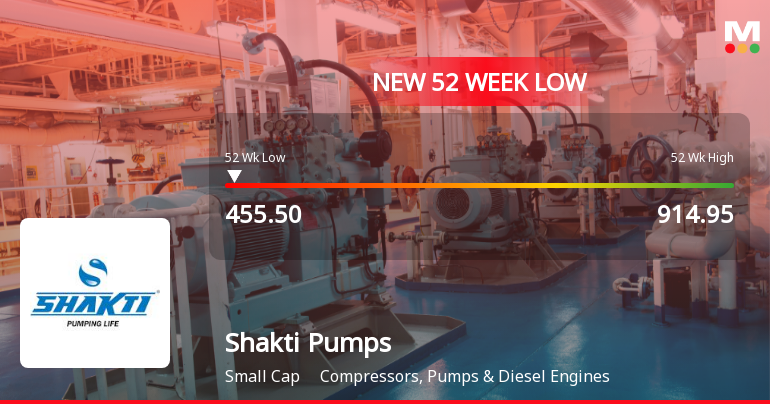
Shakti Pumps

  • Market Cap: Small Cap
  • Industry: Compressors, Pumps & Diesel Engines
  • ISIN: INE908D01010
  • NSEID: SHAKTIPUMP
  • BSEID: 531431
INR
518.65
-0.8 (-0.15%)
BSENSE

Aug 05, 02:21 PM

BSE+NSE Vol: 2.36 lacs

  • Price Points
  • Score
  • Mojo Parameters
  • Total Return
  • News and Corporate Actions
  • Key factors
  • Shareholding
  • Financials
  • CompanyCV
stock-summaryPrice Point
High/Low

1Day

52 Week

Valuation
Technical
Day's Volume

CASH

2.36 lacs (-24.25%) Volume

Shareholding (Jun 2026)

FII

5.08%

Held by 83 FIIs

DII

2.39%

Held by 3 DIIs

Promoter

50.36%

Why is Shakti Pumps (India) Ltd falling/rising?

05-Aug-2026

As of 04-Aug, Shakti Pumps (India) Ltd's stock price has risen slightly to 519.45, but it has underperformed its sector and is trading below all moving averages. The stock has declined significantly over the past month and year, with negative financial results and reduced institutional investor participation indicating ongoing challenges.

As of 04-Aug, Shakti Pumps (India) Ltd is experiencing a slight rise in its stock price, currently at 519.45, reflecting a change of 0.45 (0.09%) upward. This increase comes after two consecutive days of decline, indicating a potential trend reversal. However, despite this short-term gain, the stock has underperformed its sector by 0.73% today and is trading below all its moving averages, including the 5-day, 20-day, 50-day, 100-day, and 200-day averages.<BR><BR>Over the past month, the stock has seen a significant decline of 9.57%, and year-to-date, it has dropped by 28.33%. In the last year, the stock has generated a return of -37.13%, which is considerably worse than the market average, as the BSE500 has returned 2.91% during the same period. This underperformance is compounded by negative financial results over the last four consecutive quarters, including a 46.7% fall in profit after tax.<BR><BR>Additionally, there has been a decrease in participation from institutional investors, who have reduced their stake by 2.34% in the previous quarter. This decline in institutional interest may reflect a lack of confidence in the company's future performance, especially given the significant drop in profits and the high growth in interest expenses.<BR><BR>While there is some positive news regarding rising investor participation in terms of delivery volume, the overall financial health and market performance of Shakti Pumps suggest that the stock is facing considerable challenges, which may limit any sustained upward movement in its price.

View full answer

Are Shakti Pumps (India) Ltd latest results good or bad?

25-Jul-2026

Shakti Pumps (India) Ltd's latest Q1 FY27 results show mixed performance; while revenue grew by 37.94% to ₹858.67 crores, net profit plummeted by 46.72% to ₹51.59 crores, and operating margins fell to 9.65%, indicating significant operational challenges. Overall, the results are unfavorable due to the sharp decline in profitability despite strong sales growth.

Shakti Pumps (India) Ltd's latest results for Q1 FY27 present a mixed picture, but overall, they lean towards the negative side. While the company achieved a notable revenue growth of 37.94% year-on-year, reaching ₹858.67 crores, its net profit fell sharply by 46.72% to ₹51.59 crores. This significant decline in profitability is concerning, especially given the robust sales figures.<BR><BR>Additionally, the operating margin has dropped dramatically from 23.06% in the same quarter last year to just 9.65%, marking the lowest level in recent quarters. This indicates serious operational challenges, likely due to factors such as pricing pressures, increased costs, or a shift in product mix towards lower-margin segments.<BR><BR>Despite the strong revenue growth, the deterioration in profit margins and net profit suggests that the company is facing significant headwinds. The financial performance reflects a critical need for management to address these issues to restore profitability and investor confidence. Overall, the results can be viewed as unfavorable due to the sharp decline in net profit and operating margins despite the increase in sales.

View full answer

Should I buy, sell or hold Shakti Pumps (India) Ltd?

25-Jul-2026

When is the next results date for Shakti Pumps (India) Ltd?

17-Jul-2026

The next results date for Shakti Pumps (India) Ltd is 24 July 2026.

The next results date for Shakti Pumps (India) Ltd is scheduled for 24 July 2026.

View full answer

How big is Shakti Pumps?

11-Jun-2026

As of 10th June, Shakti Pumps (India) Ltd has a market capitalization of 6,417.00 Cr, with recent net sales of 2,697.61 Cr and a net profit of 257.57 Cr.

As of 10th June, <BR><BR>Market Cap: Shakti Pumps (India) Ltd has a market capitalization of 6,417.00 Cr, categorizing it as a Small Cap company.<BR><BR>Recent Quarterly Performance: For the latest four quarters, the company reported Net Sales of 2,697.61 Cr and a Net Profit of 257.57 Cr.<BR><BR>Balance Sheet Snapshot: The latest annual period for the balance sheet is March 2025, with Shareholder's Funds reported at 1,161.17 Cr and Total Assets at 1,960.93 Cr.

View full answer

Who are in the management team of Shakti Pumps?

11-Jun-2026

The management team of Shakti Pumps includes Dinesh Patidar (Chairman & Managing Director), Sunil Patidar, Ramesh Patidar (Whole-time Directors), and several Non-Executive & Independent Directors, including Navin S Patwa, Nishtha Neema, Pramod Kumar Bhawsar, and Keyur Bipinchandra Thaker, along with Ravi Patidar as Company Secretary & Compliance Officer. They are responsible for guiding the company's strategic direction and operations.

The management team of Shakti Pumps includes the following individuals:<BR><BR>1. **Dinesh Patidar** - Chairman & Managing Director<BR>2. **Sunil Patidar** - Whole-time Director<BR>3. **Ramesh Patidar** - Whole-time Director<BR>4. **Navin S Patwa** - Non-Executive & Independent Director<BR>5. **Nishtha Neema** - Non-Executive & Independent Director<BR>6. **Ravi Patidar** - Company Secretary & Compliance Officer<BR>7. **Pramod Kumar Bhawsar** - Non-Executive & Independent Director<BR>8. **Keyur Bipinchandra Thaker** - Non-Executive & Independent Director<BR><BR>This team plays a crucial role in guiding the company's strategic direction and operations.

View full answer

Who are the peers of the Shakti Pumps?

11-Jun-2026

Shakti Pumps' peers include Elgi Equipments, KSB, Kirl. Brothers, Ingersoll-Rand, Kirl.Pneumatic, Swaraj Engines, Oswal Pumps, and Greaves Cotton. Among these, Elgi Equipments shows the highest 1-year return at 14.98%, while Shakti Pumps has the lowest at -47.12%.

Peers: The peers of Shakti Pumps are Elgi Equipments, KSB, Kirl. Brothers, Ingersoll-Rand, Kirl.Pneumatic, Swaraj Engines, Oswal Pumps, and Greaves Cotton.<BR><BR>Quality Snapshot: Excellent management risk is observed at Elgi Equipments and Ingersoll-Rand, while Good management risk is found at KSB, Kirl. Brothers, Kirl.Pneumatic, Shakti Pumps, Swaraj Engines, and Oswal Pumps, and Average management risk is noted at Greaves Cotton. Growth is rated as Good for Elgi Equipments, Ingersoll-Rand, Kirl.Pneumatic, and Shakti Pumps, while Below Average growth is seen at KSB, Kirl. Brothers, and Swaraj Engines, and Excellent growth is noted at Oswal Pumps. Excellent capital structure is present in Elgi Equipments, KSB, Kirl. Brothers, Ingersoll-Rand, Kirl.Pneumatic, Shakti Pumps, Swaraj Engines, and Oswal Pumps, while Greaves Cotton has a Good capital structure.<BR><BR>Return Snapshot: The peer with the highest 1-year return is Elgi Equipments at 14.98%, while Shakti Pumps has the lowest at -47.12%. Shakti Pumps' 1-year return is significantly lower than all peers. Additionally, KSB, Kirl. Brothers, Swaraj Engines, Oswal Pumps, and Greaves Cotton have negative six-month returns.

View full answer

What does Shakti Pumps do?

10-Jun-2026

Shakti Pumps (India) Ltd is a leading manufacturer of energy-efficient solar pumping solutions and stainless steel pumps, established in 1982 and became a public company in 1995. As of March 2026, it reported net sales of 858 Cr and a net profit of 38 Cr, with a market cap of INR 6,417 Cr.

Overview: <BR>Shakti Pumps (India) Ltd is a leading manufacturer of energy-efficient solar pumping solutions, stainless steel pumps, and motors, operating in the compressors, pumps, and diesel engines industry within the small-cap market.<BR><BR>History: <BR>Shakti Pumps was established in January 1982 as a partnership firm and underwent three reconstitutions before becoming a public limited company in 1995. The latest quarterly results reported net sales and net profit for March 2026.<BR><BR>Financial Snapshot: <BR>Net Sales: 858 Cr (Quarterly Results - Mar 2026) <BR>Net Profit: 38 Cr (Quarterly Results - Mar 2026) <BR>Market Cap: INR 6,417 Cr (Small Cap)<BR><BR>Key Metrics: <BR>P/E: 25.00 <BR>Industry P/E: 33 <BR>Dividend Yield: 0.19% <BR>Debt-Equity: -0.11 <BR>Return on Equity: 15.10% <BR>Price to Book: 3.80 <BR><BR>Contact Details: <BR>Address: Plot No 401 402 & 413 Sec III, Industrial Area Pithampur Dist Dhar Madhya Pradesh : 454775 <BR>Tel: 91-7292-410500/410525 <BR>Email: cs@shaktipumpsindia.com <BR>Website: http://www.shaktipumps.com

View full answer

Is Shakti Pumps overvalued or undervalued?

05-Dec-2025

As of December 4, 2025, Shakti Pumps is fairly valued with a PE ratio of 19.00, an EV to EBITDA of 13.14, and a ROCE of 31.16%, significantly lower than peers like Elgi Equipments and KSB, despite a year-to-date stock decline of 41.84% compared to a 9.12% gain in the Sensex.

As of 4 December 2025, the valuation grade for Shakti Pumps has moved from expensive to fair. The company is currently fairly valued. Key ratios include a PE ratio of 19.00, an EV to EBITDA of 13.14, and a ROCE of 31.16%. <BR><BR>In comparison with peers, Shakti Pumps has a PE ratio that is significantly lower than Elgi Equipments at 39.86 and KSB at 49.71, both categorized as very expensive. Despite recent stock performance showing a decline of 41.84% year-to-date versus a 9.12% gain in the Sensex, the overall valuation suggests that Shakti Pumps is positioned reasonably within its industry.

View full answer

How has been the historical performance of Shakti Pumps?

09-Nov-2025

Shakti Pumps has experienced significant growth in net sales and profitability from March 2023 to March 2025, with net sales increasing from 967.68 Cr to 2,516.24 Cr and profit after tax rising from 24.13 Cr to 408.37 Cr, despite challenges in cash flow management. Total debt also increased, while total assets grew substantially, indicating a strong balance sheet.

Answer:<BR>The historical performance of Shakti Pumps shows significant growth in net sales and profitability over the years, particularly from March 2023 to March 2025.<BR><BR>Breakdown:<BR>Shakti Pumps has demonstrated a remarkable increase in net sales, rising from 967.68 Cr in March 2023 to 2,516.24 Cr in March 2025. This growth is accompanied by a substantial increase in total operating income, which reached 2,516.24 Cr in March 2025, up from 967.68 Cr in March 2023. The company's total expenditure also rose significantly, from 901.13 Cr in March 2023 to 1,913.29 Cr in March 2025, primarily driven by increased raw material costs and other expenses. Operating profit, excluding other income, surged to 602.95 Cr in March 2025, compared to 66.55 Cr in March 2023, reflecting improved operational efficiency. Profit before tax also saw a substantial increase, reaching 555.80 Cr in March 2025, up from 32.25 Cr in March 2023, while profit after tax rose to 408.37 Cr from 24.13 Cr in the same period. The company's total assets grew from 725.34 Cr in March 2023 to 1,960.93 Cr in March 2025, indicating a strong balance sheet. However, total debt increased from 68.40 Cr in March 2023 to 167.76 Cr in March 2025. Cash flow from operating activities showed a decline to 20.00 Cr in March 2025 from 38.00 Cr in March 2023, and the closing cash and cash equivalents decreased to 57.00 Cr in March 2025 from 11.00 Cr in March 2023. Overall, Shakti Pumps has shown a robust performance trajectory with significant growth in sales and profitability, despite challenges in cash flow management.

View full answer

Is Shakti Pumps technically bullish or bearish?

04-Nov-2025

As of November 3, 2025, the technical trend is bearish with moderate strength, driven by bearish MACD and moving averages, despite a mildly bullish monthly Bollinger Bands, and the stock's underperformance against the Sensex reinforces this outlook.

As of 3 November 2025, the technical trend has changed from mildly bearish to bearish. The current stance is bearish with a moderate strength. Key indicators driving this include a bearish MACD on the weekly time-frame, bearish moving averages on the daily time-frame, and a bearish KST on the weekly. The Bollinger Bands indicate a mildly bullish stance on the monthly, but this is overshadowed by the overall bearish signals from other indicators. The stock has also underperformed compared to the Sensex on a year-to-date basis, further supporting the bearish outlook.

View full answer

Who are the top shareholders of the Shakti Pumps?

17-Jul-2025

The top shareholders of Shakti Pumps include the Shakti Sons Trust with 18.33%, mutual funds at 6.28%, foreign institutional investors at 5.72%, and individual investors holding 31.77%. The largest public shareholder is Lic Mutual Fund, owning 3.97%.

The top shareholders of Shakti Pumps include the promoters, with the Shakti Sons Trust holding the largest stake at 18.33%. Additionally, mutual funds collectively hold 6.28% through 10 schemes, while foreign institutional investors (FIIs) own 5.72% across 97 entities. The highest public shareholder is Lic Mutual Fund, which holds 3.97%. Individual investors also have a significant presence, owning 31.77% of the company.

View full answer

What is the bonus history of the Shakti Pumps?

06-Jun-2025

Shakti Pumps has a history of issuing bonus shares, with the most recent being a 5:1 bonus announced on November 25, 2024, and a previous 1:1 bonus issued on April 28, 2011. This reflects the company's commitment to rewarding its shareholders.

Shakti Pumps has a notable bonus history. The most recent bonus issue was a 5:1 bonus, which was announced with an ex-date of November 25, 2024. Prior to that, the company issued a 1:1 bonus on April 28, 2011, with a record date of April 29, 2011. This indicates that Shakti Pumps has a history of rewarding its shareholders through bonus shares.

View full answer

Has Shakti Pumps declared dividend?

06-Jun-2025

Yes, Shakti Pumps (India) Ltd has declared a 40% dividend, amounting to ₹4 per share, with an ex-date of September 23, 2024. The company has shown strong total returns over various periods, including a 3400.47% total return over the last 5 years.

Shakti Pumps (India) Ltd has declared a 40% dividend.<BR><BR>Dividend Details:<BR>- Percentage announced: 40%<BR>- Amount per share: 4<BR>- Ex-date: 23 Sep 24<BR><BR>Dividend Yield: 0.07%.<BR><BR>Total Returns by Period:<BR>In the last 6 months, Shakti Pumps has achieved a price return of 22.23%, with no dividend return, resulting in a total return of 22.23%.<BR><BR>Over the past year, the company has seen a price return of 126.18%, a dividend return of 0.91%, leading to a total return of 127.09%.<BR><BR>In the last 2 years, the price return was 842.12%, with a dividend return of 6.08%, culminating in a total return of 848.2%.<BR><BR>For the 3-year period, the price return reached 1070.16%, while the dividend return was 10.41%, resulting in a total return of 1080.57%.<BR><BR>Over the past 4 years, Shakti Pumps experienced a price return of 558.56% and a dividend return of 12.19%, achieving a total return of 570.75%.<BR><BR>In the last 5 years, the company has recorded a remarkable price return of 3343.27%, with a dividend return of 57.20%, leading to an impressive total return of 3400.47%.<BR><BR>Overall, Shakti Pumps has declared a significant dividend while demonstrating strong total returns across various periods, indicating a robust financial performance and shareholder value creation.

View full answer
iScoreScore
Click here to find our call on this stock
Strong Sell
Sell
Hold
Buy
Strong Buy

Dashboard

1

The company has declared Negative results for the last 4 consecutive quarters

  • INTEREST(9M) At Rs 50.58 cr has Grown at 41.13%
  • PBT LESS OI(Q) At Rs 60.71 cr has Fallen at -52.48%
  • PAT(Q) At Rs 51.59 cr has Fallen at -46.7%
2

Falling Participation by Institutional Investors

3

Underperformed the market in the last 1 year

stock-summaryMojo Parameters

Mojo Parameters

Loading Valuation Snapshot...

Stock DNA

stock-summary
Industry

Compressors, Pumps & Diesel Engines

stock-summary
Market cap

INR 6,400 Cr (Small Cap)

stock-summary
P/E

30.00

stock-summary
Industry P/E

34

stock-summary
Dividend Yield

0.38%

stock-summary
Debt Equity

-0.11

stock-summary
Return on Equity

15.10%

stock-summary
Price to Book

3.76

Revenue and Profits:
Net Sales:
859 Cr
(Quarterly Results - Jun 2026)
Net Profit:
52 Cr
stock-summaryTotal Returns
Total Returns (Price + Dividend) stock-summary
Dividend Yield (0.38%)
TimePeriod
Price Return
Dividend Return
Total Return
3 Months
-5.43%
0.17%
-5.26%
6 Months
-16.68%
0.16%
-16.52%
1 Year
-36.76%
0.24%
-36.52%
2 Years
-36.1%
0.36%
-35.74%
3 Years
310.97%
2.55%
313.52%
4 Years
561.54%
3.95%
565.49%
5 Years
320.13%
3.90%
324.03%

Latest dividend: 0.9997128637059725 per share ex-dividend date: Jul-29-2026

Risk Adjusted Returns v/s stock-summary
Returns Beta
Icon
Beta has not been calculated since enough price history is not available
stock-summaryNews & Corporate Actions

News

Announcements stock-summary

Announcement under Regulation 30 (LODR)-Earnings Call Transcript

01-Aug-2026 | Source : BSE

We are submitting herewith Transcript of Earnings Call held on Monday July 27 2026.

Announcement under Regulation 30 (LODR)-Analyst / Investor Meet - Outcome

27-Jul-2026 | Source : BSE

We are submitting herewith the audio recording of conference call held on today i.e. Monday July 272026.

Announcement under Regulation 30 (LODR)-Monitoring Agency Report

25-Jul-2026 | Source : BSE

We are submitting herewith Monitoring Agency Reports dated 24.07.2026 issued by India Ratings & Research Private Limited for the quarter ended 30.06.2026.

Corporate Actions stock-summary

stock-summary
BOARD MEETING

No Upcoming Board Meetings

stock-summary
DIVIDEND

Shakti Pumps (India) Ltd has declared 10% dividend, ex-date: 29 Jul 26

stock-summary
SPLITS

No Splits history available

stock-summary
BONUS

Shakti Pumps (India) Ltd has announced 5:1 bonus issue, ex-date: 25 Nov 24

stock-summary
RIGHTS

No Rights history available

stock-summaryKey Factors

Quality key factors stock-summary

Factor
Value
Sales Growth (5y)
24.17%
EBIT Growth (5y)
21.52%
EBIT to Interest (avg)
7.80
Debt to EBITDA (avg)
0.97
Net Debt to Equity (avg)
-0.11
Sales to Capital Employed (avg)
1.83
Tax Ratio
29.35%
Dividend Payout Ratio
4.79%
Pledged Shares
0
Institutional Holding
7.46%
ROCE (avg)
27.31%
ROE (avg)
18.26%

Valuation key factors

Factor
Value
P/E Ratio
30
Industry P/E
34
Price to Book Value
3.76
EV to EBIT
18.78
EV to EBITDA
17.22
EV to Capital Employed
4.12
EV to Sales
2.12
PEG Ratio
NA
Dividend Yield
0.38%
ROCE (Latest)
26.06%
ROE (Latest)
15.10%

Technicals key factors

Indicator
Weekly
Monthly
MACD
Mildly Bullish
Bearish
RSI
No Signal
No Signal
Bollinger Bands
Bearish
Bearish
Moving Averages
Bearish (Daily)
KST
Bullish
Mildly Bearish
Dow Theory
No Trend
No Trend
OBV
Mildly Bearish
No Trend
stock-summary Technical Indicator Scale: Bearish, Mildly Bearish, Sideways, Mildly Bullish, Bullish  Turned 
stock-summaryShareholding
Shareholding Snapshot : Jun 2026stock-summary
Shareholding Compare (%holding) stock-summary
Majority shareholders

Promoters

Pledged Promoter Holdings

None

Mutual Funds

Held by 8 Schemes (2.33%)

FIIs

Held by 83 FIIs (5.08%)

Promoter with highest holding

Shakti Sons Trust (18.36%)

Highest Public shareholder

Snehal Bhupendra Shah (1.91%)

Individual Investors Holdings

35.87%

stock-summaryFinancial
[
  {
    "link": "quarterly",
    "btn_text": "All Quarterly Results",
    "header": "Quarterly Results Snapshot (Consolidated) - Jun'26 - YoY",
    "rhs": [
      {
        "prefix": "Net Sales ",
        "suffix": "YoY Growth in quarter ended Jun 2026 is 37.94% vs 9.68% in Jun 2025",
        "dir": 1
      },
      {
        "prefix": "Consolidated Net Profit ",
        "suffix": "YoY Growth in quarter ended Jun 2026 is -46.72% vs 4.50% in Jun 2025",
        "dir": -1
      }
    ],
    "table": {
      "header": [
        "Jun'26",
        "Jun'25",
        "Change(%)"
      ],
      "body": [
        {
          "field": "Net Sales",
          "val1": "858.67",
          "val2": "622.50",
          "chgp": "37.94%",
          "chgp_class": "positive"
        },
        {
          "field": "Operating Profit (PBDIT) excl Other Income",
          "val1": "82.86",
          "val2": "143.57",
          "chgp": "-42.29%",
          "chgp_class": "negative"
        },
        {
          "field": "Interest",
          "val1": "14.57",
          "val2": "9.76",
          "chgp": "49.28%",
          "chgp_class": "negative"
        },
        {
          "field": "Exceptional Items",
          "val1": "0.00",
          "val2": "0.00",
          "chgp": "",
          "chgp_class": "neutral"
        },
        {
          "field": "Consolidate Net Profit",
          "val1": "51.59",
          "val2": "96.83",
          "chgp": "-46.72%",
          "chgp_class": "negative"
        },
        {
          "field": "Operating Profit Margin (Excl OI)",
          "val1": "9.65%",
          "val2": "23.06%",
          "chgp": "-13.41%",
          "chgp_class": "negative"
        }
      ]
    }
  },
  {
    "link": "half-yearly",
    "btn_text": "All Half Yearly Results",
    "header": "Half Yearly Results Snapshot (Consolidated) - Sep'25",
    "rhs": [
      {
        "prefix": "Net Sales ",
        "suffix": " Growth in half year ended Sep 2025 is 7.21% vs 352.21% in Sep 2024",
        "dir": -1
      },
      {
        "prefix": "Consolidated Net Profit ",
        "suffix": " Growth in half year ended Sep 2025 is -3.37% vs 2,733.28% in Sep 2024",
        "dir": -1
      }
    ],
    "table": {
      "header": [
        "Sep'25",
        "Sep'24",
        "Change(%)"
      ],
      "body": [
        {
          "field": "Net Sales",
          "val1": "1,288.85",
          "val2": "1,202.15",
          "chgp": "7.21%",
          "chgp_class": "positive"
        },
        {
          "field": "Operating Profit (PBDIT) excl Other Income",
          "val1": "279.52",
          "val2": "284.58",
          "chgp": "-1.78%",
          "chgp_class": "negative"
        },
        {
          "field": "Interest",
          "val1": "23.06",
          "val2": "19.56",
          "chgp": "17.89%",
          "chgp_class": "negative"
        },
        {
          "field": "Exceptional Items",
          "val1": "0.00",
          "val2": "0.00",
          "chgp": "",
          "chgp_class": "neutral"
        },
        {
          "field": "Consolidate Net Profit",
          "val1": "187.54",
          "val2": "194.08",
          "chgp": "-3.37%",
          "chgp_class": "negative"
        },
        {
          "field": "Operating Profit Margin (Excl OI)",
          "val1": "21.69%",
          "val2": "23.67%",
          "chgp": "-1.98%",
          "chgp_class": "negative"
        }
      ]
    }
  },
  {
    "link": "nine-monthly",
    "btn_text": "All Nine Monthly Results",
    "header": "Nine Monthly Results Snapshot (Consolidated) - Dec'25",
    "rhs": [
      {
        "prefix": "Net Sales ",
        "suffix": "YoY Growth in nine months ended Dec 2025 is -0.60% vs 143.08% in Dec 2024",
        "dir": -1
      },
      {
        "prefix": "Consolidated Net Profit ",
        "suffix": "YoY Growth in nine months ended Dec 2025 is -26.46% vs 472.89% in Dec 2024",
        "dir": -1
      }
    ],
    "table": {
      "header": [
        "Dec'25",
        "Dec'24",
        "Change(%)"
      ],
      "body": [
        {
          "field": "Net Sales",
          "val1": "1,839.84",
          "val2": "1,850.92",
          "chgp": "-0.60%",
          "chgp_class": "negative"
        },
        {
          "field": "Operating Profit (PBDIT) excl Other Income",
          "val1": "338.55",
          "val2": "439.00",
          "chgp": "-22.88%",
          "chgp_class": "negative"
        },
        {
          "field": "Interest",
          "val1": "41.17",
          "val2": "31.46",
          "chgp": "30.86%",
          "chgp_class": "negative"
        },
        {
          "field": "Exceptional Items",
          "val1": "0.00",
          "val2": "0.00",
          "chgp": "",
          "chgp_class": "neutral"
        },
        {
          "field": "Consolidate Net Profit",
          "val1": "219.24",
          "val2": "298.13",
          "chgp": "-26.46%",
          "chgp_class": "negative"
        },
        {
          "field": "Operating Profit Margin (Excl OI)",
          "val1": "18.40%",
          "val2": "23.72%",
          "chgp": "-5.32%",
          "chgp_class": "negative"
        }
      ]
    }
  },
  {
    "link": "annual",
    "btn_text": "All Annual Results",
    "header": "Annual Results Snapshot (Consolidated) - Mar'26",
    "rhs": [
      {
        "prefix": "Net Sales ",
        "suffix": "YoY Growth in year ended Mar 2026 is 7.21% vs 83.57% in Mar 2025",
        "dir": -1
      },
      {
        "prefix": "Consolidated Net Profit ",
        "suffix": "YoY Growth in year ended Mar 2026 is -36.92% vs 188.13% in Mar 2025",
        "dir": -1
      }
    ],
    "table": {
      "header": [
        "Mar'26",
        "Mar'25",
        "Change(%)"
      ],
      "body": [
        {
          "field": "Net Sales",
          "val1": "2,697.61",
          "val2": "2,516.24",
          "chgp": "7.21%",
          "chgp_class": "positive"
        },
        {
          "field": "Operating Profit (PBDIT) excl Other Income",
          "val1": "421.70",
          "val2": "602.95",
          "chgp": "-30.06%",
          "chgp_class": "negative"
        },
        {
          "field": "Interest",
          "val1": "59.07",
          "val2": "44.25",
          "chgp": "33.49%",
          "chgp_class": "negative"
        },
        {
          "field": "Exceptional Items",
          "val1": "0.00",
          "val2": "0.00",
          "chgp": "",
          "chgp_class": "neutral"
        },
        {
          "field": "Consolidate Net Profit",
          "val1": "257.58",
          "val2": "408.37",
          "chgp": "-36.92%",
          "chgp_class": "negative"
        },
        {
          "field": "Operating Profit Margin (Excl OI)",
          "val1": "15.63%",
          "val2": "23.96%",
          "chgp": "-8.33%",
          "chgp_class": "negative"
        }
      ]
    }
  }
]

Quarterly Results Snapshot (Consolidated) - Jun'26 - YoYstock-summary

Jun'26
Jun'25
Change(%)
Net Sales
858.67
622.50
37.94%
Operating Profit (PBDIT) excl Other Income
82.86
143.57
-42.29%
Interest
14.57
9.76
49.28%
Exceptional Items
0.00
0.00
Consolidate Net Profit
51.59
96.83
-46.72%
Operating Profit Margin (Excl OI)
9.65%
23.06%
-13.41%
Values in Rs Cr.
Direction Arrows
Net Sales

YoY Growth in quarter ended Jun 2026 is 37.94% vs 9.68% in Jun 2025

Direction Arrows
Consolidated Net Profit

YoY Growth in quarter ended Jun 2026 is -46.72% vs 4.50% in Jun 2025

Half Yearly Results Snapshot (Consolidated) - Sep'25stock-summary

Sep'25
Sep'24
Change(%)
Net Sales
1,288.85
1,202.15
7.21%
Operating Profit (PBDIT) excl Other Income
279.52
284.58
-1.78%
Interest
23.06
19.56
17.89%
Exceptional Items
0.00
0.00
Consolidate Net Profit
187.54
194.08
-3.37%
Operating Profit Margin (Excl OI)
21.69%
23.67%
-1.98%
Values in Rs Cr.
Direction Arrows
Net Sales

Growth in half year ended Sep 2025 is 7.21% vs 352.21% in Sep 2024

Direction Arrows
Consolidated Net Profit

Growth in half year ended Sep 2025 is -3.37% vs 2,733.28% in Sep 2024

Nine Monthly Results Snapshot (Consolidated) - Dec'25stock-summary

Dec'25
Dec'24
Change(%)
Net Sales
1,839.84
1,850.92
-0.60%
Operating Profit (PBDIT) excl Other Income
338.55
439.00
-22.88%
Interest
41.17
31.46
30.86%
Exceptional Items
0.00
0.00
Consolidate Net Profit
219.24
298.13
-26.46%
Operating Profit Margin (Excl OI)
18.40%
23.72%
-5.32%
Values in Rs Cr.
Direction Arrows
Net Sales

YoY Growth in nine months ended Dec 2025 is -0.60% vs 143.08% in Dec 2024

Direction Arrows
Consolidated Net Profit

YoY Growth in nine months ended Dec 2025 is -26.46% vs 472.89% in Dec 2024

Annual Results Snapshot (Consolidated) - Mar'26stock-summary

Mar'26
Mar'25
Change(%)
Net Sales
2,697.61
2,516.24
7.21%
Operating Profit (PBDIT) excl Other Income
421.70
602.95
-30.06%
Interest
59.07
44.25
33.49%
Exceptional Items
0.00
0.00
Consolidate Net Profit
257.58
408.37
-36.92%
Operating Profit Margin (Excl OI)
15.63%
23.96%
-8.33%
Values in Rs Cr.
Direction Arrows
Net Sales

YoY Growth in year ended Mar 2026 is 7.21% vs 83.57% in Mar 2025

Direction Arrows
Consolidated Net Profit

YoY Growth in year ended Mar 2026 is -36.92% vs 188.13% in Mar 2025

stock-summaryCompany CV
About Shakti Pumps (India) Ltd stock-summary
stock-summary
Shakti Pumps (India) Ltd
Small Cap
Compressors, Pumps & Diesel Engines
Shakti Pumps (India) Limited was established in January, 1982 as a partnership firm in the name of 'Shakti Electrical Industries'. The partnership firm was reconstituted three times in 1986, 1990 and 1994, before being converted into a public limited company in 1995. It was promoted by M. L. Patidar family of Indore. The Company is engaged in manufacturing of Pumps, Motors & their spare parts. The core products of the Company are Engineered Pumps, Industrial Pumps, and Solar Pumps etc.
Company Coordinates stock-summary
Company Details
Plot No 401 402 & 413 Sec III, Industrial Area Pithampur Dist Dhar Madhya Pradesh : 454775
stock-summary
Tel: 91-7292-410500/410525
stock-summary
cs@shaktipumpsindia.com
Registrar Details
Adroit Corporate Services Pvt Ltd, 17-20 Jaferbhoy Industrial Estate , 1st Floor, Makwana Road, Marol Naka, Mumbai