
Stock DNA
Non Banking Financial Company (NBFC)
INR 3,580 Cr (Small Cap)
631.00
23
0.00%
1.03
5.09%
32.65
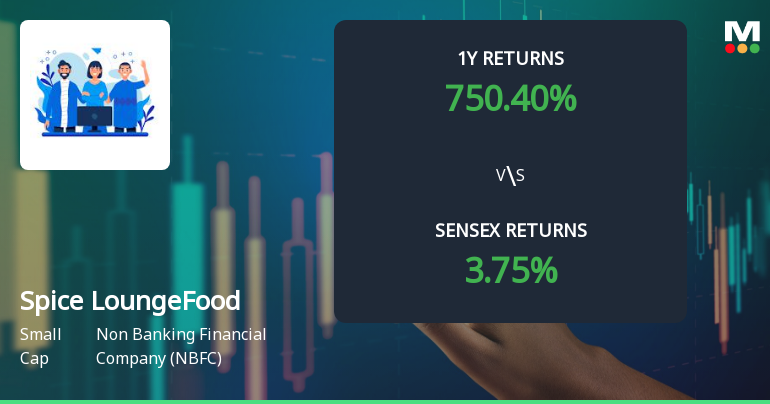
Total Returns (Price + Dividend) 
Spice LoungeFood for the last several years.
Risk Adjusted Returns v/s
Returns Beta

News
Spice Lounge Food Works Sees Shift in Technical Momentum Amid Market Volatility
Spice Lounge Food Works, a player in the Non Banking Financial Company (NBFC) sector, has experienced a notable shift in its technical momentum, reflecting a nuanced change in market sentiment. Recent price movements and technical indicators suggest a transition from a bullish to a mildly bullish trend, with mixed signals from key momentum oscillators and moving averages.
Read More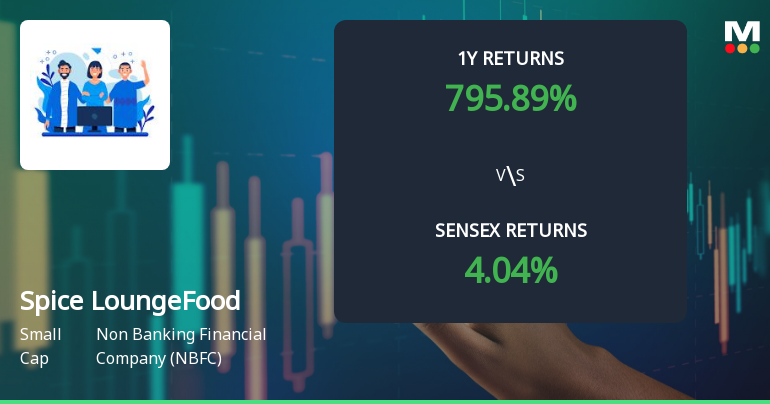
Spice Lounge Food Works Shows Shift in Price Momentum Amid Mixed Technical Signals
Spice Lounge Food Works has experienced a notable shift in its price momentum, reflecting a transition from a mildly bullish to a bullish technical trend. This development is underscored by a combination of technical indicators including MACD, RSI, moving averages, and Bollinger Bands, which collectively paint a nuanced picture of the stock’s current market stance within the Non Banking Financial Company (NBFC) sector.
Read More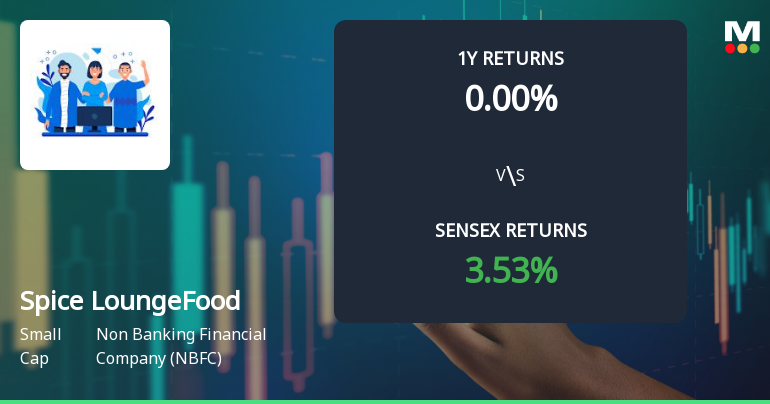
Spice Lounge Food Works Sees Mixed Technical Signals Amid Price Momentum Shift
Spice Lounge Food Works, a player in the Non Banking Financial Company (NBFC) sector, has experienced a notable shift in its technical momentum, reflected in a combination of bullish and bearish signals across key indicators. The stock’s recent price movement and technical parameters suggest a nuanced market assessment, with mixed signals from MACD, RSI, moving averages, and other momentum indicators.
Read More Announcements
Board Meeting Outcome for Outcome Of Board Meeting Pursuant To Regulation 29 And 30 Of The SEBI (Listing Obligations And Disclosure Requirements) Regulation 2015
17-Dec-2025 | Source : BSE1. The Board approved the acquisition of M/s PRISHA INFOTECH PTE. LTD a Singapore based entity at USD 150000 /- (USD One Lakh and Fifty Thousand Only) This will result in M/s PRISHA INFOTECH PTE. LTD. becoming the wholly owned subsidiary of the Company w.e.f 01st Jan 2026.
Board Meeting Intimation for INTIMATION OF BOARD MEETING TO BE HELD ON 17.12.2025
13-Dec-2025 | Source : BSESpice Lounge Food Works Ltdhas informed BSE that the meeting of the Board of Directors of the Company is scheduled on 17/12/2025 inter alia to consider and approve Pursuant to Regulation 29 and 30 of the Securities and Exchange Board of India (Listing Obligations and Disclosure Requirements) Regulations 2015 we wish to inform you that a meeting of Board of Directors of the Company is scheduled to be held on Wednesday the 17th Day of December 2025 at 02.30 PM at the Registered Office of the Company inter-alia to consider the following: 1. Consider and discuss proposals for acquisition(s) of entity(ies)/business(es) - In India or Outside India subject to such approvals as may be required; and 2. Transact any other business with the permission of the Chair.
Announcement under Regulation 30 (LODR)-Press Release / Media Release
04-Dec-2025 | Source : BSEPress Release - Spice Lounge Food Works Ltd- Announces that it has secured exclusive Master Franchise Rights for Wing Zone an internationally recognised Quick Service Restaurant (QSR) brand
Corporate Actions

No Upcoming Board Meetings

No Dividend history available

Spice Lounge Food Works Ltd has announced 1:10 stock split, ex-date: 13 Mar 25

No Bonus history available

No Rights history available
Quality key factors
Valuation key factors
Technicals key factors
 Technical Indicator Scale: Bearish, Mildly Bearish, Sideways, Mildly Bullish, Bullish Turned
 Shareholding Snapshot : Sep 2025
Shareholding Compare (%holding)
Non Institution
None
Held by 0 Schemes
Held by 0 FIIs
None
Mohana Babu Karjela (40.36%)
49.79%
Quarterly Results Snapshot (Standalone) - Sep'25 - YoY

YoY Growth in quarter ended Sep 2025 is 345.45% vs 0.00% in Sep 2024
YoY Growth in quarter ended Sep 2025 is 20.00% vs 0.00% in Sep 2024
Half Yearly Results Snapshot (Standalone) - Sep'25
Growth in half year ended Sep 2025 is 681.82% vs 0.00% in Sep 2024
Growth in half year ended Sep 2025 is 666.67% vs 0.00% in Sep 2024
Nine Monthly Results Snapshot (Standalone) - Dec'24
YoY Growth in nine months ended Dec 2024 is 0.00% vs 0.00% in Dec 2023

YoY Growth in nine months ended Dec 2024 is 0.00% vs 100.00% in Dec 2023
Annual Results Snapshot (Standalone) - Mar'25
YoY Growth in year ended Mar 2025 is 0.00% vs 0.00% in Mar 2024
YoY Growth in year ended Mar 2025 is 480.00% vs 44.44% in Mar 2024
About Spice Lounge Food Works Ltd

Company Coordinates


