
Compare Shankara Buildpr with Similar Stocks
Dashboard
High Management Efficiency with a high ROE of 0%
The company is Net-Debt Free
Healthy long term growth as Net Sales has grown by an annual rate of 0% and Operating profit at 0%
With a growth in Net Profit of 65.68%, the company declared Very Positive results in Mar 26
With ROE of 23.7, it has a Very Attractive valuation with a 4.7 Price to Book Value
High Institutional Holdings at 23.1%
Stock DNA
Retailing
INR 2,629 Cr (Small Cap)
20.00
72
0.47%
-0.01
23.74%
4.71
Total Returns (Price + Dividend) 
Latest dividend: 5.001970443349753 per share ex-dividend date: Jun-24-2026
Risk Adjusted Returns v/s
Returns Beta

News
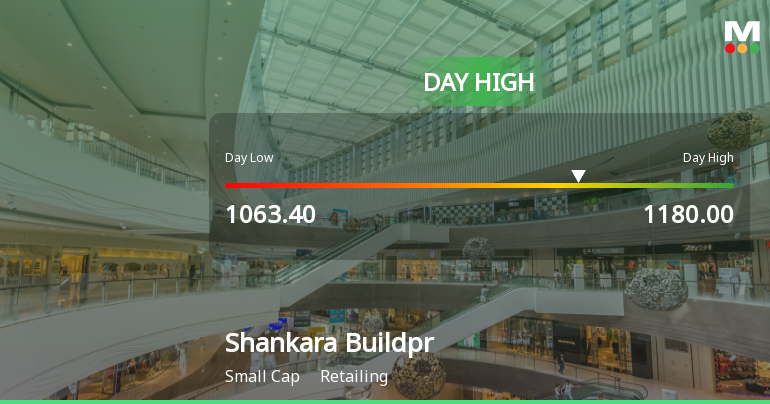
Shankara Buildpro Ltd Surges 9.18% to Day's High of Rs 1160 — Outperforms Sector by 9.54 Percentage Points
The Sensex rose 0.7% on 09 Jul 2026, yet Shankara Buildpro Ltd outpaced the broader market with a 9.18% gain, reaching an intraday high of Rs 1160. This 9.54 percentage-point outperformance over its Retailing sector peers highlights a distinctly stock-specific rally rather than a market-wide lift.
Read full news article
Shankara Buildpro Ltd Technical Momentum Shifts Amid Mixed Market Returns
Shankara Buildpro Ltd, a small-cap player in the retailing sector, has exhibited a notable shift in its technical momentum, moving from a sideways trend to a mildly bullish stance. This change is underscored by a 5.28% gain in the stock price on 9 Jul 2026, reflecting renewed investor interest despite mixed signals from various technical indicators.
Read full news article
Shankara Buildpro Ltd Technical Momentum Shifts Amid Market Pressure
Shankara Buildpro Ltd, a small-cap player in the retailing sector, has experienced a notable shift in price momentum and technical indicators, prompting a downgrade in its Mojo Grade from Buy to Hold as of 6 July 2026. The stock’s recent performance and technical signals suggest a transition from a mildly bearish trend to a sideways consolidation phase, raising questions about its near-term trajectory amid broader market dynamics.
Read full news article Announcements
Shareholder Meeting / Postal Ballot-Scrutinizers Report
03-Jul-2026 | Source : BSEVoting Results under Regulation 44 of the SEBI (Listing Obligations and Disclosure Requirements) 2015of 3rd Annual General Meeting held on Thursday 2nd July 2026
Shareholder Meeting / Postal Ballot-Outcome of AGM
02-Jul-2026 | Source : BSEProceedings of 3rd Annual General Meeting
Closure of Trading Window
25-Jun-2026 | Source : BSEClosure of Trading Window
Corporate Actions

No Upcoming Board Meetings

Shankara Buildpro Ltd has declared 50% dividend, ex-date: 24 Jun 26

No Splits history available

No Bonus history available

No Rights history available
Quality key factors
Valuation key factors
Technicals key factors
 Technical Indicator Scale: Bearish, Mildly Bearish, Sideways, Mildly Bullish, Bullish Turned
 Shareholding Snapshot : Mar 2026
Shareholding Compare (%holding)
Promoters
None
Held by 1 Schemes (4.66%)
Held by 57 FIIs (10.97%)
Sukumar Srinivas (38.72%)
Franklin India Small Cap Fund (4.66%)
24.85%
Quarterly Results Snapshot (Standalone) - Mar'26 - QoQ

QoQ Growth in quarter ended Mar 2026 is 19.81% vs 4.34% in Dec 2025
QoQ Growth in quarter ended Mar 2026 is 65.68% vs -15.35% in Dec 2025
Half Yearly Results Snapshot (Standalone) - Sep'25
Not Applicable: The company has declared_date for only one period
Not Applicable: The company has declared_date for only one period
Nine Monthly Results Snapshot (Standalone) - Dec'25
Not Applicable: The company has declared_date for only one period
Not Applicable: The company has declared_date for only one period
Annual Results Snapshot (Standalone) - Mar'26
Not Applicable: The company has declared_date for only one period
Not Applicable: The company has declared_date for only one period
About Shankara Buildpro Ltd

Company Coordinates


