
Compare Shankara Buildpr with Similar Stocks
Dashboard
High Management Efficiency with a high ROE of 0%
The company is Net-Debt Free
Healthy long term growth as Net Sales has grown by an annual rate of 0% and Operating profit at 0%
With a growth in Net Profit of 65.68%, the company declared Very Positive results in Mar 26
With ROE of 23.7, it has a Very Attractive valuation with a 5.6 Price to Book Value
Stock DNA
Retailing
INR 2,927 Cr (Small Cap)
24.00
73
0.42%
-0.01
23.74%
5.33
Total Returns (Price + Dividend) 
Latest dividend: 5.001970443349753 per share ex-dividend date: Jun-24-2026
Risk Adjusted Returns v/s
Returns Beta

News
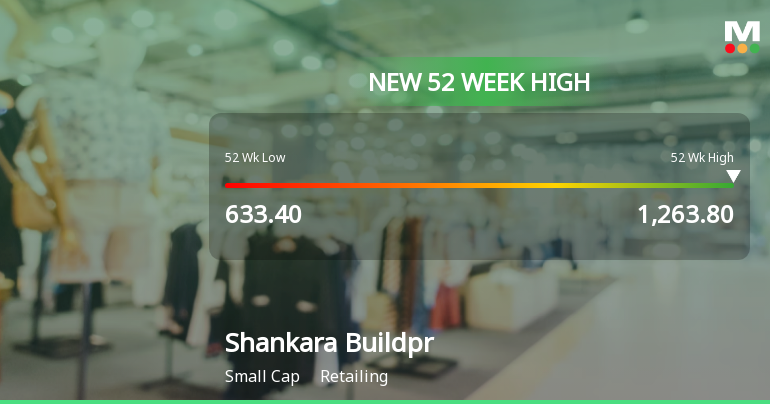
Broad-Based Technical Strength Lifts Shankara Buildpro Ltd to 52-Week High of Rs 1263.8
With a decisive break above Rs 1263.8 on 10 Jul 2026, Shankara Buildpro Ltd has reached a fresh 52-week and all-time high, propelled by a confluence of strong technical signals and sustained price momentum.
Read full news article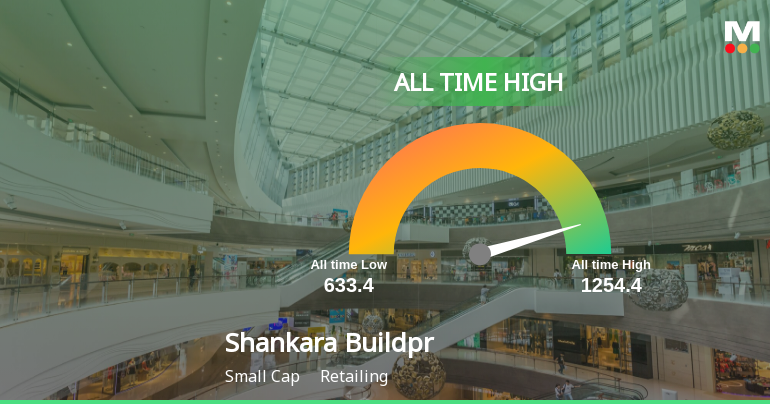

Shankara Buildpro Ltd Upgraded to Strong Buy on Robust Financials and Technical Momentum
Shankara Buildpro Ltd has seen its investment rating upgraded from Hold to Strong Buy, reflecting significant improvements across quality, valuation, financial trends, and technical indicators. The company’s recent quarterly performance, coupled with positive market sentiment and technical signals, has driven this decisive upgrade, positioning it favourably within the retailing sector.
Read full news article Announcements
Shareholder Meeting / Postal Ballot-Scrutinizers Report
03-Jul-2026 | Source : BSEVoting Results under Regulation 44 of the SEBI (Listing Obligations and Disclosure Requirements) 2015of 3rd Annual General Meeting held on Thursday 2nd July 2026
Shareholder Meeting / Postal Ballot-Outcome of AGM
02-Jul-2026 | Source : BSEProceedings of 3rd Annual General Meeting
Closure of Trading Window
25-Jun-2026 | Source : BSEClosure of Trading Window
Corporate Actions

No Upcoming Board Meetings

Shankara Buildpro Ltd has declared 50% dividend, ex-date: 24 Jun 26

No Splits history available

No Bonus history available

No Rights history available
Quality key factors
Valuation key factors
Technicals key factors
 Technical Indicator Scale: Bearish, Mildly Bearish, Sideways, Mildly Bullish, Bullish Turned
 Shareholding Snapshot : Mar 2026
Shareholding Compare (%holding)
Promoters
None
Held by 1 Schemes (4.66%)
Held by 57 FIIs (10.97%)
Sukumar Srinivas (38.72%)
Franklin India Small Cap Fund (4.66%)
24.85%
Quarterly Results Snapshot (Standalone) - Mar'26 - QoQ

QoQ Growth in quarter ended Mar 2026 is 19.81% vs 4.34% in Dec 2025
QoQ Growth in quarter ended Mar 2026 is 65.68% vs -15.35% in Dec 2025
Half Yearly Results Snapshot (Standalone) - Sep'25
Not Applicable: The company has declared_date for only one period
Not Applicable: The company has declared_date for only one period
Nine Monthly Results Snapshot (Standalone) - Dec'25
Not Applicable: The company has declared_date for only one period
Not Applicable: The company has declared_date for only one period
Annual Results Snapshot (Standalone) - Mar'26
Not Applicable: The company has declared_date for only one period
Not Applicable: The company has declared_date for only one period
About Shankara Buildpro Ltd

Company Coordinates


