Shanthi Gears

  • Market Cap: Small Cap
  • Industry: Industrial Manufacturing
  • ISIN: INE631A01022
  • NSEID: SHANTIGEAR
  • BSEID: 522034
INR
465.30
3.15 (0.68%)
BSENSE

May 06

BSE+NSE Vol: 15.66 k

  • Price Points
  • Score
  • Mojo Parameters
  • Total Return
  • News and Corporate Actions
  • Key factors
  • Shareholding
  • Financials
  • CompanyCV
stock-summaryPrice Point
High/Low

1Day

52 Week

Valuation
Technical
Day's Volume

CASH

15.66 k (-55.00%) Volume

Shareholding (Mar 2026)

FII

3.13%

Held by 28 FIIs

DII

0.00%

Held by 1 DIIs

Promoter

70.47%

Who are in the management team of Shanthi Gears?

06-Jun-2025

As of March 2023, the management team of Shanthi Gears includes J Balamurugan, Soundara Kumar, S K Sundararaman, N Krishna Samaraj, Arunachalam Murugappa Arunachalam, M Karunakaran (CEO), Mukesh Ahuja, L Ramkumar, Walter Vasanth P J (Company Secretary), and Arun Venkatachalam, featuring a mix of independent directors and executive leadership.

As of March 2023, the management team of Shanthi Gears includes the following individuals:<BR><BR>1. J Balamurugan - Independent Director<BR>2. Soundara Kumar - Independent Director<BR>3. S K Sundararaman - Independent Director<BR>4. N Krishna Samaraj - Independent Director<BR>5. Arunachalam Murugappa Arunachalam Murugappan - Chairman (Non-Executive)<BR>6. M Karunakaran - Whole Time Director & CEO<BR>7. Mukesh Ahuja - Director<BR>8. L Ramkumar - Independent Director<BR>9. Walter Vasanth P J - Company Secretary & Compliance Officer<BR>10. Arun Venkatachalam - Director<BR><BR>This team comprises a mix of independent directors, executive leadership, and compliance oversight.

View full answer

What does Shanthi Gears do?

06-Jun-2025

Shanthi Gears Ltd. is a small-cap gear manufacturing company established in 1969, with recent quarterly net sales of ₹153 Cr and a net profit of ₹22 Cr as of March 2025. The company has a market cap of ₹3,870 Cr and key financial metrics include a P/E ratio of 40.00 and a return on equity of 23.83%.

Overview:<BR>Shanthi Gears Ltd. is a gear manufacturing company operating in the industrial manufacturing sector and is categorized as a small-cap company.<BR><BR>History:<BR>Shanthi Gears Ltd. was promoted in 1969 as a partnership concern and was converted into a Private Limited Company in July 1972. It later became a Public Limited Company in March 1986. The latest quarterly results reported net sales and net profit for the period ending March 2025.<BR><BR>Financial Snapshot:<BR>- Net Sales: 153 Cr (Quarterly Results - Mar 2025)<BR>- Net Profit: 22 Cr (Quarterly Results - Mar 2025)<BR>- Market Cap: Rs 3,870 Cr (Small Cap)<BR><BR>Key Metrics:<BR>- P/E: 40.00<BR>- Industry P/E: 36<BR>- Dividend Yield: 1.06%<BR>- Debt Equity: -0.34<BR>- Return on Equity: 23.83%<BR>- Price to Book: 9.61<BR><BR>Contact Details:<BR>Address: 304-A Trichy Road, Singanallur Coimbatore Tamil Nadu : 641005<BR>Tel: 91-0422-2273722-34<BR>Email: cs@shanthigears.com<BR>Website: http://www.shanthigears.com

View full answer

Who are the peers of the Shanthi Gears?

03-Jun-2025

Shanthi Gears' peers include Kaynes Tech, Honeywell Auto, Jyoti CNC Auto, LMW, Jupiter Wagons, Centum Electron, Pitti Engg., Standard Glass, Jash Engineering, and Windsor Machines. In terms of performance, Shanthi Gears has a 1-year return of -8.59%, ranking higher than Honeywell Auto but lower than its other peers.

Peers: The peers of Shanthi Gears are Kaynes Tech, Honeywell Auto, Jyoti CNC Auto., LMW, Jupiter Wagons, Centum Electron, Pitti Engg., Standard Glass, Jash Engineering, and Windsor Machines.<BR><BR>Quality Snapshot: Excellent management risk is observed at Honeywell Auto and Jyoti CNC Auto., while Average management risk is found at Kaynes Tech, LMW, Jupiter Wagons, Shanthi Gears, Centum Electron, Pitti Engg., Standard Glass, Jash Engineering, and Windsor Machines. Excellent growth is noted at Kaynes Tech and Jyoti CNC Auto., while Good growth is seen at Shanthi Gears and Pitti Engg. Average growth is present at Jash Engineering, while Below Average growth is found at Honeywell Auto, LMW, Centum Electron, and the rest. Excellent capital structure is noted at Honeywell Auto, LMW, Shanthi Gears, and Standard Glass, while Good capital structure is observed at Kaynes Tech, Jyoti CNC Auto., Jash Engineering, and the rest.<BR><BR>Return Snapshot: The peer with the highest 1-year return is Kaynes Tech at 65.35%, while the lowest is Honeywell Auto at -26.32%. Shanthi Gears has a 1-year return of -8.59%, which is higher than Honeywell Auto but lower than all other peers. Additionally, peers with negative six-month returns include LMW, Jupiter Wagons, Pitti Engg., and Shanthi Gears.

View full answer

Is Shanthi Gears overvalued or undervalued?

09-Jun-2025

As of December 22, 2021, Shanthi Gears is considered very expensive and overvalued with a PE ratio of 40.34, significantly higher than its peers, indicating caution for potential investors despite a recent strong performance.

As of 22 December 2021, the valuation grade for Shanthi Gears has moved from expensive to very expensive, indicating a significant shift in its perceived value. The company is currently considered overvalued. Key ratios include a PE ratio of 40.34, an EV to EBITDA of 29.05, and a Price to Book Value of 9.61, all of which suggest that the stock is trading at a premium compared to its earnings and assets.<BR><BR>In comparison to its peers, Shanthi Gears' PE ratio is notably higher than Samvardhana Motherson, which has a PE of 29.14 and is rated as attractive. Additionally, Bosch, classified as expensive, has a PE of 46.21. The substantial difference in these ratios highlights Shanthi Gears' overvaluation in the current market context. Despite a strong recent performance, with a 1-week return of 5.68% compared to the Sensex's 1.40%, the overall valuation metrics suggest caution for potential investors.

View full answer

Who are the top shareholders of the Shanthi Gears?

17-Jul-2025

The top shareholder of Shanthi Gears is Tube Investments Of India Limited, holding 70.46%. Other significant shareholders include Pacific Assets Trust Plc at 2.9%, individual investors with 20.68%, and foreign institutional investors holding 3.26%.

The top shareholders of Shanthi Gears include the promoters, with Tube Investments Of India Limited holding the largest share at 70.46%. In terms of public shareholders, Pacific Assets Trust Plc is the highest with a holding of 2.9%. Additionally, individual investors collectively hold 20.68% of the company's shares. The company also has 6 mutual fund schemes holding a small portion of 0.2%, and 36 foreign institutional investors (FIIs) holding 3.26%.

View full answer

How big is Shanthi Gears?

24-Jul-2025

As of 24th July, Shanthi Gears Ltd. has a market capitalization of 4,542.00 Cr, with recent net sales of 604.62 Cr and net profit of 96.03 Cr over the last four quarters.

As of 24th July, <BR><BR>Market Cap: Shanthi Gears Ltd. has a market capitalization of 4,542.00 Cr, categorizing it as a Small Cap company.<BR><BR>Recent Quarterly Performance: The sum of Net Sales for the latest 4 quarters is 604.62 Cr, while the sum of Net Profit for the same period is 96.03 Cr.<BR><BR>Balance Sheet Snapshot: The reporting period is March 2025, with Shareholder's Funds amounting to 402.99 Cr and Total Assets totaling 499.06 Cr.

View full answer

How has been the historical performance of Shanthi Gears?

03-Nov-2025

Shanthi Gears has shown consistent growth, with net sales increasing from 215.53 Cr in Mar'21 to 604.62 Cr in Mar'25, and profit after tax rising from 20.17 Cr to 96.03 Cr in the same period, reflecting strong operational efficiency and enhanced shareholder value. Total assets grew from 278.90 Cr to 499.06 Cr, indicating balanced growth.

Answer:<BR>The historical performance of Shanthi Gears shows a consistent growth trajectory in net sales and profitability over the years.<BR><BR>Breakdown:<BR>Shanthi Gears has demonstrated significant growth in net sales, increasing from 215.53 Cr in Mar'21 to 604.62 Cr in Mar'25. This upward trend reflects a steady rise in total operating income, which also rose from 242.29 Cr in Mar'20 to 604.62 Cr in Mar'25. The company's total expenditure has similarly increased, from 188.88 Cr in Mar'21 to 475.89 Cr in Mar'25, yet the operating profit (PBDIT) has improved markedly, reaching 143.39 Cr in Mar'25 compared to 34.93 Cr in Mar'21. Profit before tax has also seen a substantial increase, from 26.07 Cr in Mar'21 to 130.09 Cr in Mar'25, leading to a profit after tax of 96.03 Cr in Mar'25, up from 20.17 Cr in Mar'21. The earnings per share have risen from 2.63 in Mar'21 to 12.52 in Mar'25, indicating enhanced shareholder value. On the balance sheet, total assets grew from 278.90 Cr in Mar'20 to 499.06 Cr in Mar'25, while total liabilities increased from 322.95 Cr to 499.06 Cr during the same period, reflecting a balanced growth in both assets and liabilities. Cash flow from operating activities has improved significantly, reaching 90.00 Cr in Mar'25, compared to 30.00 Cr in Mar'21, showcasing the company's strong operational efficiency.

View full answer

Is Shanthi Gears technically bullish or bearish?

03-Dec-2025

As of December 2, 2025, Shanthi Gears is in a bearish trend with moderate strength, indicated by bearish signals from the MACD, KST, Bollinger Bands, and moving averages, alongside a lack of momentum in the RSI and negative returns compared to the Sensex.

As of 2 December 2025, the technical trend has changed from mildly bearish to bearish. The current technical stance for Shanthi Gears is bearish with a moderate strength. Key indicators driving this stance include the weekly MACD and KST both showing bearish signals, along with bearish readings from the Bollinger Bands and daily moving averages. The RSI shows no signal on both weekly and monthly time frames, indicating a lack of momentum. Overall, the absence of a clear trend in Dow Theory and the negative stock returns compared to the Sensex further support the bearish outlook.

View full answer

When is the next results date for Shanthi Gears Ltd.?

13-Jan-2026

The next results date for Shanthi Gears Ltd. is January 22, 2026.

The next results date for Shanthi Gears Ltd. is scheduled for January 22, 2026.

View full answer

Has Shanthi Gears Ltd. declared dividend?

23-Jan-2026

Yes, Shanthi Gears Ltd. has declared a dividend of 300%, with an ex-date of January 29, 2026. The company has shown varying total returns over different periods, with significant long-term growth.

Shanthi Gears Ltd. has declared a dividend.<BR><BR>Dividend Details:<BR>- Percentage announced: 300%<BR>- Ex-date: 29 Jan 26<BR><BR>Dividend Yield: 1.12%<BR><BR>Total Returns by Period:<BR>In the 3 Months period, the price return was -14.19%, the dividend return was 0.59%, resulting in a total return of -13.6%.<BR><BR>In the 6 Months period, the price return was -21.9%, the dividend return was 0.53%, leading to a total return of -21.37%.<BR><BR>In the 1 Year period, the price return was -1.92%, the dividend return was 1.93%, culminating in a total return of 0.01%.<BR><BR>In the 2 Years period, the price return was -19.48%, the dividend return was 2.44%, resulting in a total return of -17.04%.<BR><BR>In the 3 Years period, the price return was 30.43%, the dividend return was 4.46%, leading to a total return of 34.89%.<BR><BR>In the 4 Years period, the price return was 178.46%, the dividend return was 11.36%, culminating in a total return of 189.82%.<BR><BR>In the 5 Years period, the price return was 271.7%, the dividend return was 17.66%, resulting in a total return of 289.36%.<BR><BR>Overall, Shanthi Gears Ltd. has declared a significant dividend and has shown varying total returns across different periods, with a notable increase in returns over the longer term. The recent dividend declaration and the positive long-term performance may be encouraging for investors.

View full answer

Are Shanthi Gears Ltd. latest results good or bad?

06-May-2026

Shanthi Gears Ltd.'s latest Q4 FY26 results are considered poor, with a 27.55% decline in net profit and an 11.82% drop in revenue year-on-year, alongside a contracting operating margin and underperformance compared to the industrial sector. Overall, these trends raise concerns about the company's profitability and market position.

Shanthi Gears Ltd.'s latest results for Q4 FY26 indicate a challenging performance. The company reported a net profit of ₹16.27 crore, which reflects a significant decline of 27.55% year-on-year. Revenue also decreased by 11.82% year-on-year, totaling ₹135.10 crore, despite a sequential recovery of 15.65% from the previous quarter.<BR><BR>The operating margin has contracted to 17.68%, down 252 basis points from the same quarter last year, indicating pressure on profitability. While the return on equity remains strong at 18.59%, the overall financial trend is negative, with both revenue and profit showing year-on-year declines.<BR><BR>Additionally, the stock has underperformed significantly compared to the industrial manufacturing sector, with a 9.61% decline over the past year versus the sector's 24.13% gain. This underperformance, combined with the elevated price-to-earnings ratio of 44.31, suggests that the current results are not favorable and raise concerns about the company's operational effectiveness and market positioning.<BR><BR>In summary, the latest results for Shanthi Gears Ltd. are generally viewed as bad, reflecting ongoing challenges in revenue generation and profitability.

View full answer

Should I buy, sell or hold Shanthi Gears Ltd.?

06-May-2026

Why is Shanthi Gears Ltd. falling/rising?

06-May-2026

As of 06-May, Shanthi Gears Ltd. is seeing a slight stock price increase to 465.15, but has mixed performance with a year-to-date decline of 1.18% and a 5.17% drop over the past year. Despite increased investor interest, negative financial results and high valuation relative to peers may lead to caution among investors.

As of 06-May, Shanthi Gears Ltd. is experiencing a slight rise in its stock price, currently at 465.15, with a change of 2.8 (0.61%) upward. However, the stock has shown mixed performance over various time frames. Over the past week, it has underperformed with a decline of 2.19%, while in the last month, it has gained 2.31%. Year-to-date, the stock is down 1.18%, and over the past year, it has fallen by 5.17%. <BR><BR>Despite the recent uptick in price, the stock's performance today indicates it has underperformed its sector, which has gained by 2.9%. Additionally, while the stock is trading above its 50-day and 100-day moving averages, it is below its 5-day, 20-day, and 200-day moving averages, suggesting some volatility in its recent trading patterns.<BR><BR>Investor participation has increased significantly, with delivery volume rising by 454.75% compared to the 5-day average, indicating growing interest. However, the company has declared negative results for the last three consecutive quarters, with a notable decline in profit after tax (PAT) by 11.1% compared to the previous four-quarter average. This negative financial performance, coupled with a high valuation relative to its peers, may contribute to investor caution despite the current price rise. <BR><BR>Overall, while there is a minor increase in stock price, the underlying financial challenges and recent performance metrics suggest a complex situation for Shanthi Gears Ltd.

View full answer
iScoreScore
Click here to find our call on this stock
Strong Sell
Sell
Hold
Buy
Strong Buy

Dashboard

1

The company has declared Negative results for the last 3 consecutive quarters

  • ROCE(HY) Lowest at 24.42%
  • PAT(Q) At Rs 18.67 cr has Fallen at -11.1% (vs previous 4Q average)
2

With ROE of 18.2, it has a Very Expensive valuation with a 8.1 Price to Book Value

3

Despite the size of the company, domestic mutual funds hold only 0.03% of the company
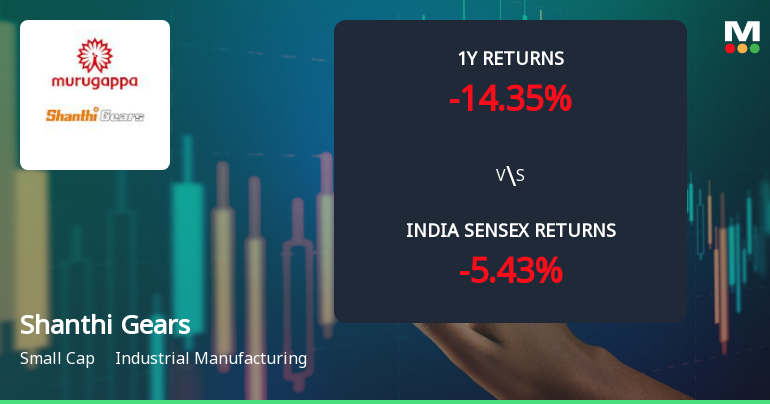
stock-summaryMojo Parameters

Mojo Parameters

Loading Valuation Snapshot...

Stock DNA

stock-summary
Industry

Industrial Manufacturing

stock-summary
Market cap

INR 3,505 Cr (Small Cap)

stock-summary
P/E

44.00

stock-summary
Industry P/E

37

stock-summary
Dividend Yield

1.15%

stock-summary
Debt Equity

-0.40

stock-summary
Return on Equity

18.59%

stock-summary
Price to Book

8.24

Revenue and Profits:
Net Sales:
135 Cr
(Quarterly Results - Mar 2026)
Net Profit:
16 Cr
stock-summaryTotal Returns
Total Returns (Price + Dividend) stock-summary
Dividend Yield (1.15%)
TimePeriod
Price Return
Dividend Return
Total Return
3 Months
2.52%
0%
2.52%
6 Months
-1.99%
0.62%
-1.37%
1 Year
-4.28%
1.03%
-3.25%
2 Years
-16.78%
1.76%
-15.02%
3 Years
29.86%
3.52%
33.38%
4 Years
110.12%
7.79%
117.91%
5 Years
202.14%
13.70%
215.84%

Latest dividend: 3 per share ex-dividend date: Jan-29-2026

Risk Adjusted Returns v/s stock-summary
Returns Beta
Icon
Beta has not been calculated since enough price history is not available
stock-summaryNews & Corporate Actions

News

Announcements stock-summary

Shanthi Gears Limited - Other General Purpose

21-Nov-2019 | Source : NSE

Shanthi Gears Limited has has submitted to the Exchange a copy of Related Party Transactions for the half year ended September 30, 2019.

Shanthi Gears Limited - Updates

06-Nov-2019 | Source : NSE

Shanthi Gears Limited has informed the Exchange regarding 'Certificate under Regulation 74(5) of SEBI (Depositories and Participants) Regulations 2018 for the period from 1st July 2019 to 30th September, 2019'.

Shanthi Gears Limited - Press Release

22-Oct-2019 | Source : NSE

Shanthi Gears Limited has informed the Exchange regarding a press release dated October 22, 2019, titled "Press Release for Financial Results for the quarter ended 30th September 2019".

Corporate Actions stock-summary

stock-summary
BOARD MEETING

No Upcoming Board Meetings

stock-summary
DIVIDEND

Shanthi Gears Ltd. has declared 300% dividend, ex-date: 29 Jan 26

stock-summary
SPLITS

No Splits history available

stock-summary
BONUS

No Bonus history available

stock-summary
RIGHTS

No Rights history available

stock-summaryKey Factors

Quality key factors stock-summary

Factor
Value
Sales Growth (5y)
19.20%
EBIT Growth (5y)
37.63%
EBIT to Interest (avg)
84.10
Debt to EBITDA (avg)
Net Debt is too low
Net Debt to Equity (avg)
-0.32
Sales to Capital Employed (avg)
1.39
Tax Ratio
25.36%
Dividend Payout Ratio
39.94%
Pledged Shares
0
Institutional Holding
3.36%
ROCE (avg)
33.88%
ROE (avg)
20.88%

Valuation key factors

Factor
Value
P/E Ratio
44
Industry P/E
37
Price to Book Value
8.10
EV to EBIT
38.96
EV to EBITDA
32.94
EV to Capital Employed
11.43
EV to Sales
6.60
PEG Ratio
NA
Dividend Yield
1.15%
ROCE (Latest)
29.33%
ROE (Latest)
18.23%

Technicals key factors

Indicator
Weekly
Monthly
MACD
Mildly Bullish
Bearish
RSI
No Signal
No Signal
Bollinger Bands
Mildly Bullish
Bearish
Moving Averages
Mildly Bearish (Daily)
KST
Mildly Bullish
Bearish
Dow Theory
Mildly Bullish
Mildly Bearish
OBV
Mildly Bullish
Mildly Bullish
stock-summary Technical Indicator Scale: Bearish, Mildly Bearish, Sideways, Mildly Bullish, Bullish  Turned 
stock-summaryShareholding
Shareholding Snapshot : Mar 2026stock-summary
Shareholding Compare (%holding) stock-summary
Majority shareholders

Promoters

Pledged Promoter Holdings

None

Mutual Funds

Held by 5 Schemes (0.01%)

FIIs

Held by 28 FIIs (3.13%)

Promoter with highest holding

Tube Investments Of India Limited (70.46%)

Highest Public shareholder

Pacific Asstes Trust Plc (2.9%)

Individual Investors Holdings

21.09%

stock-summaryFinancial
[
  {
    "link": "quarterly",
    "btn_text": "All Quarterly Results",
    "header": "Quarterly Results Snapshot (Standalone) - Mar'26 - QoQ",
    "rhs": [
      {
        "prefix": "Net Sales ",
        "suffix": "QoQ Growth in quarter ended Mar 2026 is 15.65% vs -11.44% in Dec 2025",
        "dir": 1
      },
      {
        "prefix": "Standalone Net Profit ",
        "suffix": "QoQ Growth in quarter ended Mar 2026 is 0.49% vs -24.73% in Dec 2025",
        "dir": 1
      }
    ],
    "table": {
      "header": [
        "Mar'26",
        "Dec'25",
        "Change(%)"
      ],
      "body": [
        {
          "field": "Net Sales",
          "val1": "135.10",
          "val2": "116.82",
          "chgp": "15.65%",
          "chgp_class": "positive"
        },
        {
          "field": "Operating Profit (PBDIT) excl Other Income",
          "val1": "23.89",
          "val2": "22.99",
          "chgp": "3.91%",
          "chgp_class": "positive"
        },
        {
          "field": "Interest",
          "val1": "0.00",
          "val2": "0.00",
          "chgp": "",
          "chgp_class": "neutral"
        },
        {
          "field": "Exceptional Items",
          "val1": "-3.22",
          "val2": "-1.56",
          "chgp": "-106.41%",
          "chgp_class": "negative"
        },
        {
          "field": "Standalone Net Profit",
          "val1": "16.27",
          "val2": "16.19",
          "chgp": "0.49%",
          "chgp_class": "positive"
        },
        {
          "field": "Operating Profit Margin (Excl OI)",
          "val1": "17.68%",
          "val2": "19.68%",
          "chgp": "-2.00%",
          "chgp_class": "negative"
        }
      ]
    }
  },
  {
    "link": "half-yearly",
    "btn_text": "All Half Yearly Results",
    "header": "Half Yearly Results Snapshot (Standalone) - Sep'25",
    "rhs": [
      {
        "prefix": "Net Sales ",
        "suffix": " Growth in half year ended Sep 2025 is -9.22% vs 14.42% in Sep 2024",
        "dir": -1
      },
      {
        "prefix": "Standalone Net Profit ",
        "suffix": " Growth in half year ended Sep 2025 is -6.53% vs 20.82% in Sep 2024",
        "dir": -1
      }
    ],
    "table": {
      "header": [
        "Sep'25",
        "Sep'24",
        "Change(%)"
      ],
      "body": [
        {
          "field": "Net Sales",
          "val1": "266.80",
          "val2": "293.90",
          "chgp": "-9.22%",
          "chgp_class": "negative"
        },
        {
          "field": "Operating Profit (PBDIT) excl Other Income",
          "val1": "57.03",
          "val2": "62.81",
          "chgp": "-9.20%",
          "chgp_class": "negative"
        },
        {
          "field": "Interest",
          "val1": "0.00",
          "val2": "0.00",
          "chgp": "",
          "chgp_class": "neutral"
        },
        {
          "field": "Exceptional Items",
          "val1": "0.00",
          "val2": "0.00",
          "chgp": "",
          "chgp_class": "neutral"
        },
        {
          "field": "Standalone Net Profit",
          "val1": "44.20",
          "val2": "47.29",
          "chgp": "-6.53%",
          "chgp_class": "negative"
        },
        {
          "field": "Operating Profit Margin (Excl OI)",
          "val1": "21.38%",
          "val2": "21.37%",
          "chgp": "0.01%",
          "chgp_class": "positive"
        }
      ]
    }
  },
  {
    "link": "nine-monthly",
    "btn_text": "All Nine Monthly Results",
    "header": "Nine Monthly Results Snapshot (Standalone) - Dec'25",
    "rhs": [
      {
        "prefix": "Net Sales ",
        "suffix": "YoY Growth in nine months ended Dec 2025 is -15.02% vs 18.04% in Dec 2024",
        "dir": -1
      },
      {
        "prefix": "Standalone Net Profit ",
        "suffix": "YoY Growth in nine months ended Dec 2025 is -17.91% vs 30.05% in Dec 2024",
        "dir": -1
      }
    ],
    "table": {
      "header": [
        "Dec'25",
        "Dec'24",
        "Change(%)"
      ],
      "body": [
        {
          "field": "Net Sales",
          "val1": "383.62",
          "val2": "451.41",
          "chgp": "-15.02%",
          "chgp_class": "negative"
        },
        {
          "field": "Operating Profit (PBDIT) excl Other Income",
          "val1": "80.02",
          "val2": "97.76",
          "chgp": "-18.15%",
          "chgp_class": "negative"
        },
        {
          "field": "Interest",
          "val1": "0.00",
          "val2": "0.00",
          "chgp": "",
          "chgp_class": "neutral"
        },
        {
          "field": "Exceptional Items",
          "val1": "-1.56",
          "val2": "0.00",
          "chgp": "",
          "chgp_class": "neutral"
        },
        {
          "field": "Standalone Net Profit",
          "val1": "60.39",
          "val2": "73.57",
          "chgp": "-17.91%",
          "chgp_class": "negative"
        },
        {
          "field": "Operating Profit Margin (Excl OI)",
          "val1": "20.86%",
          "val2": "21.66%",
          "chgp": "-0.80%",
          "chgp_class": "negative"
        }
      ]
    }
  },
  {
    "link": "annual",
    "btn_text": "All Annual Results",
    "header": "Annual Results Snapshot (Standalone) - Mar'26",
    "rhs": [
      {
        "prefix": "Net Sales ",
        "suffix": "YoY Growth in year ended Mar 2026 is -14.21% vs 12.79% in Mar 2025",
        "dir": -1
      },
      {
        "prefix": "Standalone Net Profit ",
        "suffix": "YoY Growth in year ended Mar 2026 is -20.17% vs 16.75% in Mar 2025",
        "dir": -1
      }
    ],
    "table": {
      "header": [
        "Mar'26",
        "Mar'25",
        "Change(%)"
      ],
      "body": [
        {
          "field": "Net Sales",
          "val1": "518.72",
          "val2": "604.62",
          "chgp": "-14.21%",
          "chgp_class": "negative"
        },
        {
          "field": "Operating Profit (PBDIT) excl Other Income",
          "val1": "103.91",
          "val2": "128.73",
          "chgp": "-19.28%",
          "chgp_class": "negative"
        },
        {
          "field": "Interest",
          "val1": "0.00",
          "val2": "0.00",
          "chgp": "",
          "chgp_class": "neutral"
        },
        {
          "field": "Exceptional Items",
          "val1": "-4.78",
          "val2": "0.00",
          "chgp": "",
          "chgp_class": "neutral"
        },
        {
          "field": "Standalone Net Profit",
          "val1": "76.66",
          "val2": "96.03",
          "chgp": "-20.17%",
          "chgp_class": "negative"
        },
        {
          "field": "Operating Profit Margin (Excl OI)",
          "val1": "20.03%",
          "val2": "21.29%",
          "chgp": "-1.26%",
          "chgp_class": "negative"
        }
      ]
    }
  }
]

Quarterly Results Snapshot (Standalone) - Mar'26 - QoQstock-summary

Mar'26
Dec'25
Change(%)
Net Sales
135.10
116.82
15.65%
Operating Profit (PBDIT) excl Other Income
23.89
22.99
3.91%
Interest
0.00
0.00
Exceptional Items
-3.22
-1.56
-106.41%
Standalone Net Profit
16.27
16.19
0.49%
Operating Profit Margin (Excl OI)
17.68%
19.68%
-2.00%
Values in Rs Cr.
Direction Arrows
Net Sales

QoQ Growth in quarter ended Mar 2026 is 15.65% vs -11.44% in Dec 2025

Direction Arrows
Standalone Net Profit

QoQ Growth in quarter ended Mar 2026 is 0.49% vs -24.73% in Dec 2025

Half Yearly Results Snapshot (Standalone) - Sep'25stock-summary

Sep'25
Sep'24
Change(%)
Net Sales
266.80
293.90
-9.22%
Operating Profit (PBDIT) excl Other Income
57.03
62.81
-9.20%
Interest
0.00
0.00
Exceptional Items
0.00
0.00
Standalone Net Profit
44.20
47.29
-6.53%
Operating Profit Margin (Excl OI)
21.38%
21.37%
0.01%
Values in Rs Cr.
Direction Arrows
Net Sales

Growth in half year ended Sep 2025 is -9.22% vs 14.42% in Sep 2024

Direction Arrows
Standalone Net Profit

Growth in half year ended Sep 2025 is -6.53% vs 20.82% in Sep 2024

Nine Monthly Results Snapshot (Standalone) - Dec'25stock-summary

Dec'25
Dec'24
Change(%)
Net Sales
383.62
451.41
-15.02%
Operating Profit (PBDIT) excl Other Income
80.02
97.76
-18.15%
Interest
0.00
0.00
Exceptional Items
-1.56
0.00
Standalone Net Profit
60.39
73.57
-17.91%
Operating Profit Margin (Excl OI)
20.86%
21.66%
-0.80%
Values in Rs Cr.
Direction Arrows
Net Sales

YoY Growth in nine months ended Dec 2025 is -15.02% vs 18.04% in Dec 2024

Direction Arrows
Standalone Net Profit

YoY Growth in nine months ended Dec 2025 is -17.91% vs 30.05% in Dec 2024

Annual Results Snapshot (Standalone) - Mar'26stock-summary

Mar'26
Mar'25
Change(%)
Net Sales
518.72
604.62
-14.21%
Operating Profit (PBDIT) excl Other Income
103.91
128.73
-19.28%
Interest
0.00
0.00
Exceptional Items
-4.78
0.00
Standalone Net Profit
76.66
96.03
-20.17%
Operating Profit Margin (Excl OI)
20.03%
21.29%
-1.26%
Values in Rs Cr.
Direction Arrows
Net Sales

YoY Growth in year ended Mar 2026 is -14.21% vs 12.79% in Mar 2025

Direction Arrows
Standalone Net Profit

YoY Growth in year ended Mar 2026 is -20.17% vs 16.75% in Mar 2025

stock-summaryCompany CV
About Shanthi Gears Ltd. stock-summary
stock-summary
Shanthi Gears Ltd.
Small Cap
Industrial Manufacturing
Shanthi Gears Ltd (SGL), the Coimbatore based gear manufacturing company was promoted by P Subramanian, an entrepreneurial engineer in 1969 as a partnership concern. In July 1972, the partnership firm was converted into a Private Limited Company and later in March 1986 it became a Public Limited Company. The Company is in the business of design, manufacture, supply and servicing of gears and gear boxes.
Company Coordinates stock-summary
Company Details
304-A Trichy Road, Singanallur Coimbatore Tamil Nadu : 641005
stock-summary
Tel: 91-0422-2273722-34
stock-summary
cs@shanthigears.com
Registrar Details
SKDC Consultants Ltd , Kanapathy Towers, 3rd Floor, Ganapathy, Coimbatore