
Compare Shanti Educat. with Similar Stocks
Dashboard
Poor Management Efficiency with a low ROE of 8.84%
- The company has been able to generate a Return on Equity (avg) of 8.84% signifying low profitability per unit of shareholders funds
Company has a Debt to Equity ratio (avg) of 0.06 times
Healthy long term growth as Net Sales has grown by an annual rate of 71.60% and Operating profit at 75.01%
Negative results in Mar 26
With ROE of 7.7, it has a Very Expensive valuation with a 43.1 Price to Book Value
High Institutional Holdings at 25.67%
Stock DNA
Other Consumer Services
INR 3,257 Cr (Small Cap)
561.00
179
0.00%
0.06
7.69%
43.05
Total Returns (Price + Dividend) 
Shanti Educat. for the last several years.
Risk Adjusted Returns v/s
Returns Beta

News

Shanti Educational Initiatives Ltd is Rated Hold
Shanti Educational Initiatives Ltd is rated 'Hold' by MarketsMOJO, with this rating last updated on 06 June 2026. However, the analysis and financial metrics discussed below reflect the company’s current position as of 11 July 2026, providing investors with an up-to-date view of its fundamentals, returns, and market standing.
Read full news article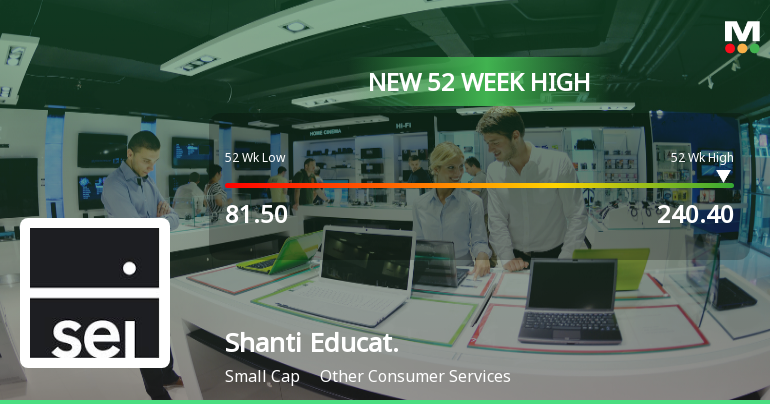
Broad-Based Technical Strength Lifts Shanti Educational Initiatives Ltd to 52-Week High of Rs 240.4
Surging past its previous peaks, Shanti Educational Initiatives Ltd touched a new 52-week high of Rs 240.4 on 6 Jul 2026, marking a remarkable rally from its low of Rs 81.5 just a year ago. This impressive 181.13% gain underscores a powerful momentum driven predominantly by a confluence of bullish technical indicators across multiple timeframes.
Read full news article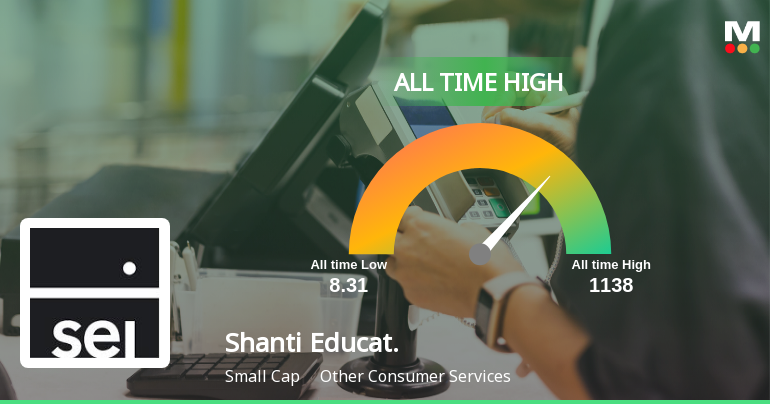
Shanti Educational Initiatives Ltd Hits All-Time High of Rs 240.4 as Momentum Builds Across Timeframes
Extending its winning streak to five consecutive sessions, Shanti Educational Initiatives Ltd surged to a fresh all-time high of Rs 240.4 on 06 Jul 2026, marking a remarkable 14.63% gain over this period and significantly outpacing the Sensex’s modest 1.75% rise in the same timeframe.
Read full news article Announcements
Compliances-Certificate under Reg. 74 (5) of SEBI (DP) Regulations 2018
07-Jul-2026 | Source : BSECompliance certificate under Reg. 74(5) of SEBI (DP) Regulations 2018
Intimation Under Regulation 30 Of SEBI (Listing Obligation And Disclosure Requirements) Regulations 2015.
02-Jul-2026 | Source : BSEGeneral Update
Closure of Trading Window
25-Jun-2026 | Source : BSEClosure of Trading Window
Corporate Actions

No Upcoming Board Meetings

No Dividend history available

Shanti Educational Initiatives Ltd has announced 1:10 stock split, ex-date: 21 Jul 22

No Bonus history available

No Rights history available
Quality key factors
Valuation key factors
Technicals key factors
 Technical Indicator Scale: Bearish, Mildly Bearish, Sideways, Mildly Bullish, Bullish Turned
 Shareholding Snapshot : Jun 2026
Shareholding Compare (%holding)
Promoters
None
Held by 0 Schemes
Held by 29 FIIs (25.67%)
Vedprakash Devkinandan Chiripal (5.28%)
Nexpact Limited (1.59%)
12.86%
Quarterly Results Snapshot (Consolidated) - Mar'26 - YoY

YoY Growth in quarter ended Mar 2026 is 22.98% vs 549.66% in Mar 2025

YoY Growth in quarter ended Mar 2026 is 308.51% vs 56.88% in Mar 2025
Half Yearly Results Snapshot (Consolidated) - Sep'25
Growth in half year ended Sep 2025 is 35.61% vs 51.23% in Sep 2024
Growth in half year ended Sep 2025 is -1.25% vs 22.32% in Sep 2024
Nine Monthly Results Snapshot (Consolidated) - Dec'25
YoY Growth in nine months ended Dec 2025 is -19.28% vs 148.61% in Dec 2024
YoY Growth in nine months ended Dec 2025 is -34.88% vs 59.07% in Dec 2024
Annual Results Snapshot (Consolidated) - Mar'26
YoY Growth in year ended Mar 2026 is -5.78% vs 209.66% in Mar 2025
YoY Growth in year ended Mar 2026 is -16.57% vs 93.42% in Mar 2025
About Shanti Educational Initiatives Ltd

Company Coordinates


