
Compare Sharda Ispat with Similar Stocks
Stock DNA
Iron & Steel Products
INR 89 Cr (Micro Cap)
14.00
26
0.00%
0.45
9.47%
1.36
Total Returns (Price + Dividend) 
Sharda Ispat for the last several years.
Risk Adjusted Returns v/s
Returns Beta

News

Sharda Ispat Ltd is Rated Sell
Sharda Ispat Ltd is rated 'Sell' by MarketsMOJO, with this rating last updated on 29 May 2026. However, the analysis and financial metrics discussed here reflect the stock's current position as of 08 June 2026, providing investors with an up-to-date view of the company’s fundamentals, valuation, financial trends, and technical outlook.
Read full news article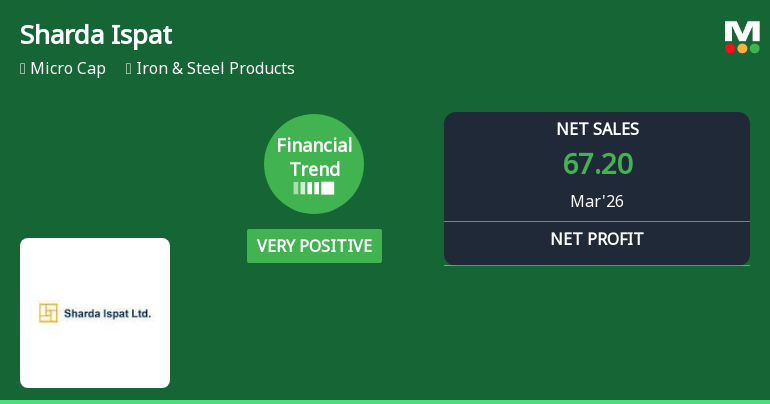
Sharda Ispat Ltd Reports Strong Quarterly Turnaround Amid Market Volatility
Sharda Ispat Ltd has delivered a remarkable financial turnaround in the quarter ended March 2026, posting its highest quarterly revenue and profit metrics in recent history. This significant improvement contrasts sharply with its previous negative trend, signalling a potential shift in the company’s operational momentum within the iron and steel products sector.
Read full news articleAre Sharda Ispat Ltd latest results good or bad?
Sharda Ispat Ltd's latest financial results for Q4 FY26 indicate a significant turnaround compared to previous quarters, with net profit reaching ₹4.35 crore, marking a substantial increase from the previous quarter and year. Revenue also saw a notable rise, reaching ₹67.20 crore, which is the highest quarterly performance recorded by the company. The operating margin improved to 8.72%, reflecting enhanced operational efficiency. Despite this strong quarterly performance, the overall full-year results for FY26 reveal a subdued picture, with total revenue declining slightly compared to FY25. This highlights the challenges faced by the company in maintaining consistent profitability throughout the year, as it experienced erratic results across different quarters. The company has demonstrated operational resilience, particularly in Q4, but the volatility in its earnings raises concerns about predictability a...
Read full news article Announcements
Announcement under Regulation 30 (LODR)-Newspaper Publication
30-May-2026 | Source : BSENewspaper publication of Audited Financial results for the quarter and year ended 31st March 2026.
Board Meeting Outcome for Outcome Of Board Meeting
29-May-2026 | Source : BSEOutcome of Board Meeting.
Audited Financial Results For The Fourth Quarter And Year Ended 31St March 2026
29-May-2026 | Source : BSEAudited Financial results for the Fourth Quarter and Year Ended 31st March 2026.
Corporate Actions

No Upcoming Board Meetings

No Dividend history available

No Splits history available

No Bonus history available

No Rights history available
Quality key factors
Valuation key factors
Technicals key factors
 Technical Indicator Scale: Bearish, Mildly Bearish, Sideways, Mildly Bullish, Bullish Turned
 Shareholding Snapshot : Mar 2026
Shareholding Compare (%holding)
Promoters
None
Held by 0 Schemes
Held by 0 FIIs
Ashadevi Nandkishore Sarda (15.07%)
None
14.93%
Quarterly Results Snapshot (Standalone) - Mar'26 - QoQ

QoQ Growth in quarter ended Mar 2026 is 41.24% vs 81.67% in Dec 2025
QoQ Growth in quarter ended Mar 2026 is 202.08% vs 1,007.69% in Dec 2025
Half Yearly Results Snapshot (Standalone) - Sep'25
Growth in half year ended Sep 2025 is -32.66% vs -31.02% in Sep 2024
Growth in half year ended Sep 2025 is -88.12% vs -44.80% in Sep 2024
Nine Monthly Results Snapshot (Standalone) - Dec'25
YoY Growth in nine months ended Dec 2025 is -24.51% vs -22.93% in Dec 2024
YoY Growth in nine months ended Dec 2025 is -71.88% vs -32.79% in Dec 2024
Annual Results Snapshot (Standalone) - Mar'26

YoY Growth in year ended Mar 2026 is -3.79% vs -22.81% in Mar 2025
YoY Growth in year ended Mar 2026 is -18.31% vs -45.67% in Mar 2025
About Sharda Ispat Ltd

Company Coordinates


