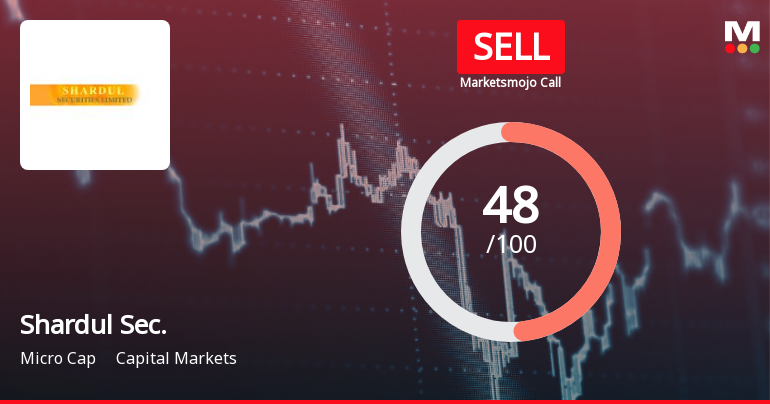
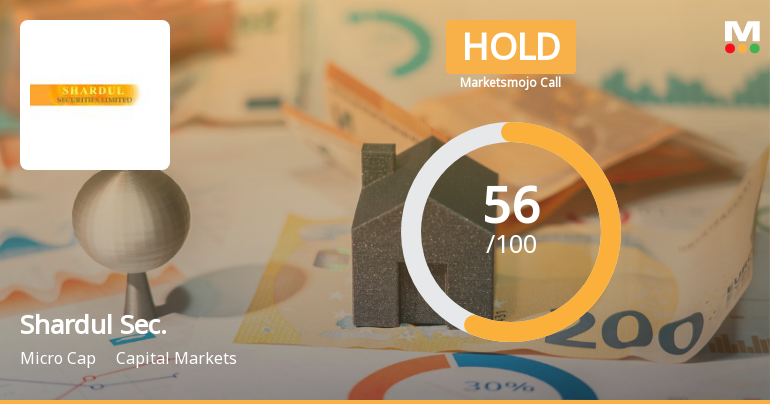
Shardul Sec.

  • Market Cap: Micro Cap
  • Industry: Capital Markets
  • ISIN: INE037B01020
  • NSEID: SHARDUL
  • BSEID: 512393
INR
51.45
2.45 (5.0%)
BSENSE

Jul 17, 03:30 PM

BSE+NSE Vol: 64.6 k

  • Price Points
  • Score
  • Mojo Parameters
  • Total Return
  • News and Corporate Actions
  • Key factors
  • Shareholding
  • Financials
  • CompanyCV
stock-summaryPrice Point
High/Low

1Day

52 Week

Valuation
Technical
Day's Volume

CASH

64.6 k (-33.11%) Volume

Shareholding (Mar 2026)

FII

0.30%

Held by 1 FIIs

DII

0.00%

Held by 0 DIIs

Promoter

74.85%

Why is Shardul Securities Ltd falling/rising?

19-Jul-2026

As of 18-Jul, Shardul Securities Ltd's stock price has risen to Rs 51.45, reflecting a 5.0% increase, with significant gains of 52.58% over the past week and 61.54% over the past month. Increased investor participation and positive technical indicators further support this upward momentum.

As of 18-Jul, Shardul Securities Ltd is experiencing a rise in its stock price, currently at Rs 51.45, reflecting an increase of 2.45 or 5.0%. The stock has shown remarkable performance over various periods, with a 52.58% increase over the past week and a 61.54% increase over the past month, significantly outperforming the Sensex, which only rose by 0.75% and 1.29% respectively during those same periods.<BR><BR>Today, the stock opened with a gain of 4.08% and has reached an intraday high of Rs 51.45, indicating strong upward momentum. Additionally, Shardul Securities has been on a consecutive gain streak for the last nine days, accumulating a total return of 88.05% during this period. The stock is also trading above its 5-day, 20-day, 50-day, 100-day, and 200-day moving averages, which is a positive technical indicator.<BR><BR>Investor participation has notably increased, with a delivery volume of 2.2 lacs on July 16, marking an impressive rise of 855.44% compared to the 5-day average delivery volume. This surge in trading activity suggests heightened interest and confidence among investors. Furthermore, the stock's liquidity is adequate for trading, as it meets the necessary thresholds based on average traded value.<BR><BR>Overall, the combination of strong recent performance, positive technical indicators, and increased investor participation contributes to the rising stock price of Shardul Securities Ltd.

View full answer

Should I buy, sell or hold Shardul Securities Ltd?

14-Jul-2026

Are Shardul Securities Ltd latest results good or bad?

11-Jul-2026

Shardul Securities Ltd's latest results show exceptional growth in net sales and profit, but the extreme volatility and previous negative performance raise concerns about sustainability. Investors should be cautious due to the unpredictability of future earnings despite the impressive quarterly figures.

The latest results for Shardul Securities Ltd present a mixed picture. On one hand, the company reported exceptional growth in net sales, reaching ₹189.26 crores in Q1 FY27, which is a remarkable 4,023.31% increase from the previous quarter's ₹4.59 crores. Additionally, net profit surged to ₹142.67 crores, reflecting a 102.74% year-on-year increase. The operating margin was also impressive at 97.74%, indicating strong profitability for the quarter.<BR><BR>However, these results come with significant caveats. The extreme volatility in quarterly performance raises concerns about the sustainability of these earnings. Prior to this quarter, the company had experienced three consecutive quarters of negative sales, suggesting that its revenue may be heavily reliant on cyclical or transaction-dependent activities rather than stable, recurring income. This volatility can make future earnings unpredictable, which is a critical factor for investors to consider.<BR><BR>Moreover, despite the strong quarterly performance, the stock has seen a decline of 42.56% from its 52-week high, reflecting market skepticism regarding the consistency of these results. The overall financial health shows a pattern of instability, with a history of fluctuating profits and losses.<BR><BR>In summary, while the latest results are impressive on the surface, the underlying volatility and historical performance issues suggest caution. Investors should weigh the potential for high returns against the risks associated with such unpredictability.

View full answer

When is the next results date for Shardul Securities Ltd?

08-Jul-2026

The next results date for Shardul Securities Ltd is July 10, 2026.

The next results date for Shardul Securities Ltd is scheduled for July 10, 2026.

View full answer

How big is Shardul Sec.?

11-Jun-2026

As of 10th June, Shardul Securities Ltd has a market capitalization of 246.00 Cr, with recent net sales of 46.32 Cr and a net profit loss of 49.13 Cr over the last four quarters. The company's shareholder's funds are 703.98 Cr, and total assets amount to 738.40 Cr as of March 2025.

As of 10th June, <BR><BR>Market Cap: Shardul Securities Ltd has a market capitalization of 246.00 Cr, categorizing it as a Micro Cap.<BR><BR>Recent Quarterly Performance: The sum of Net Sales for the latest 4 quarters is 46.32 Cr, while the sum of Net Profit for the same period reflects a loss of 49.13 Cr.<BR><BR>Balance Sheet Snapshot: The reporting period is for March 2025, with Shareholder's Funds amounting to 703.98 Cr and Total Assets totaling 738.40 Cr.

View full answer

Who are in the management team of Shardul Sec.?

11-Jun-2026

The management team of Shardul Securities includes R Sundaresan (Chairman & Executive Director), Yogendra Chaturvedi (Executive Director & CEO), Daya Bariya (Executive Director & Company Secretary), and independent directors Charul Abuwala, Devesh Vasavada, and Lalit Shah. They oversee the company's operations and strategic direction.

The management team of Shardul Securities includes the following individuals:<BR><BR>1. **R Sundaresan** - Chairman & Executive Director<BR>2. **Yogendra Chaturvedi** - Executive Director & CEO<BR>3. **Daya Bariya** - Executive Director & Company Secretary<BR>4. **Charul Abuwala** - Independent Director<BR>5. **Devesh Vasavada** - Independent Director<BR>6. **Lalit Shah** - Independent Director<BR><BR>This team is responsible for overseeing the company's operations and strategic direction. If you need more specific information about any of the members or their roles, feel free to ask!

View full answer

Who are the peers of the Shardul Sec.?

11-Jun-2026

Peers of Shardul Sec. include Adit.Birla Money, Arihant Capital, Shriram AMC, Pune e, Quest Capital, IL&FS Inv.Manag., Almondz Global, Rikhav Securitie, and Indbank Merchant. Pune e has the highest 1-year return at 70.82%, while Shriram AMC has the lowest at -54.70%, with Shardul Sec. at -34.99%.

Peers: The peers of Shardul Sec. are Adit.Birla Money, Arihant Capital, Shriram AMC, Pune e, Quest Capital, IL&FS Inv.Manag., Almondz Global, Rikhav Securitie, and Indbank Merchant.<BR><BR>Quality Snapshot: Excellent management risk is observed at Pune e, while Average management risk is found at Adit.Birla Money and LKP Securities, and the rest have Below Average management risk. Good growth is noted at Adit.Birla Money and Almondz Global, while Average growth is seen at Pune e, Rikhav Securitie, and IL&FS Inv.Manag., and the rest have Below Average growth. Excellent capital structure is consistent across Adit.Birla Money, Arihant Capital, Shriram AMC, Pune e, Quest Capital, IL&FS Inv.Manag., Almondz Global, Rikhav Securitie, Indbank Merchant, and Shardul Sec.<BR><BR>Return Snapshot: Pune e has the highest 1-year return at 70.82%, while Shriram AMC has the lowest at -54.70%, with Shardul Sec.'s 1-year return of -34.99% being better than Shriram AMC's but worse than Pune e's. Additionally, the six-month return is negative for Adit.Birla Money, Arihant Capital, Shriram AMC, Quest Capital, Almondz Global, and Rikhav Securitie.

View full answer

What does Shardul Sec. do?

10-Jun-2026

Shardul Securities Ltd is a micro-cap company in the capital markets industry, originally founded in 1985 and currently reporting net sales of 5 Cr and a net loss of 64 Cr as of March 2026. The company has a market cap of INR 246 Cr and operates from Mumbai.

Overview:<BR>Shardul Securities Ltd operates in the capital markets industry and is categorized as a micro-cap company.<BR><BR>History:<BR>The company was originally incorporated as 'Spotlight Trade & Finance Limited' in July 1985. It underwent several name changes, becoming 'Shriyam Securities & Finance Limited' in May 1993, and was renamed to 'Shardul Securities Limited' on January 9, 2003. The latest quarterly results reported net sales and net profit for the period ending March 2026.<BR><BR>Financial Snapshot:<BR>Most recent Net Sales: 5 Cr (Quarterly Results - Mar 2026) <BR>Most recent Net Profit: -64 Cr (Quarterly Results - Mar 2026) <BR>Market-cap value: INR 246 Cr (Micro Cap)<BR><BR>Key Metrics:<BR>P/E: N/A <BR>Industry P/E: 20 <BR>Dividend Yield: 0.00% <BR>Debt-Equity: 0.42 <BR>Return on Equity: -7.47% <BR>Price to Book: 0.40<BR><BR>Contact Details:<BR>Address: G-12 Tulsiani Chambers, 212 Nariman Point Mumbai Maharashtra : 400021 <BR>Tel: 91-022-40090500 <BR>Email: investors@shriyam.com <BR>Website: http://www.shardulsecurities.com

View full answer

Is Shardul Sec. overvalued or undervalued?

05-Dec-2025

As of December 4, 2025, Shardul Securities is considered very expensive and overvalued, with negative financial ratios and a year-to-date decline of 55.72%, significantly underperforming compared to its peers and the Sensex.

As of 4 December 2025, the valuation grade for Shardul Securities has moved from risky to very expensive. The company is currently overvalued, reflected by a PE ratio of -4.30, an EV to EBITDA of -5.76, and a ROE of -10.57%. Compared to peers, Bajaj Finance has a PE ratio of 34.9 and an EV to EBITDA of 19.63, while Life Insurance shows a more attractive valuation with a PE of 10.85 and an EV to EBITDA of 8.92.<BR><BR>Despite recent stock performance showing a 3.55% return over the past week against a -0.53% return for the Sensex, the longer-term outlook remains concerning, with a year-to-date decline of 55.72% compared to the Sensex's 9.12% gain. Overall, Shardul Securities appears to be significantly overvalued given its negative financial ratios and poor performance relative to its peers.

View full answer

How has been the historical performance of Shardul Sec.?

13-Nov-2025

Shardul Sec. has shown significant fluctuations in financial performance, with net sales increasing from 6.62 Cr in Mar'23 to 62.63 Cr in Mar'25, peaking at 173.28 Cr in Mar'24. Despite growth in sales and profits, cash flow has been negative, indicating mixed overall performance.

Answer:<BR>The historical performance of Shardul Sec. shows significant fluctuations in its financial metrics over the years, particularly in net sales, profits, and cash flow.<BR><BR>Breakdown:<BR>Shardul Sec. experienced a notable increase in net sales, rising from 6.62 Cr in Mar'23 to 62.63 Cr in Mar'25, although it peaked at 173.28 Cr in Mar'24. The total operating income followed a similar trend, reaching a high of 173.28 Cr in Mar'24 before dropping to 62.63 Cr in Mar'25. Operating profit (PBDIT) also saw a substantial increase, from 3.25 Cr in Mar'23 to 46.42 Cr in Mar'25, despite a peak of 163.52 Cr in Mar'24. Profit before tax mirrored this pattern, climbing to 44.79 Cr in Mar'25 from 2.86 Cr in Mar'23, while profit after tax reached 32.99 Cr in Mar'25, down from 97.81 Cr in Mar'24. The company's total assets grew from 470.81 Cr in Mar'23 to 738.40 Cr in Mar'25, with total liabilities also increasing from 696.71 Cr to 738.40 Cr in the same period. Cash flow from operating activities showed a negative trend, with -35.00 Cr in Mar'25 compared to 21.00 Cr in Mar'24, leading to a net cash outflow of -10.00 Cr in Mar'25. Overall, while Shardul Sec. demonstrated growth in sales and profits, its cash flow and profit margins have shown volatility, indicating a mixed performance in recent years.

View full answer

What is the technical trend for Shardul Sec.?

09-Jun-2025

As of June 4, 2025, Shardul Sec. has shifted to a bearish trend, supported by daily moving averages and weekly Bollinger Bands, despite mixed signals from the MACD and KST across different timeframes.

As of 4 June 2025, the technical trend for Shardul Sec. has changed from mildly bearish to bearish. The current stance is bearish with moderate strength. The daily moving averages indicate a bearish trend, while the weekly Bollinger Bands also confirm a bearish outlook. The MACD shows a mildly bullish signal on the weekly timeframe but is mildly bearish on the monthly, suggesting mixed signals across different timeframes. The KST aligns with this by being mildly bullish weekly but bearish monthly. Overall, the combination of these indicators points to a bearish sentiment in the market for Shardul Sec.

View full answer

Has Shardul Sec. declared dividend?

06-Jun-2025

Shardul Securities Ltd has declared a 6% dividend, amounting to 0.6 per share, but the dividend yield is 0% as no dividends have been paid in recent periods. Total returns show significant price appreciation over the long term, with a 5-year total return of 530.41%.

Shardul Securities Ltd has declared a 6% dividend.<BR><BR>Dividend Details:<BR>- Percentage announced: 6%<BR>- Amount per share: 0.6<BR>- Ex-date: 04 Sep 19<BR><BR>Dividend Yield: 0%<BR><BR>Total Returns by Period:<BR>In the 6-month period, the price return was -51.89%, with a dividend return of 0%, resulting in a total return of -51.89%.<BR><BR>For the 1-year period, the price return was 15.82%, with a dividend return of 0%, leading to a total return of 15.82%.<BR><BR>Over 2 years, the price return was 131.83%, the dividend return was 0%, giving a total return of 131.83%.<BR><BR>In the 3-year period, the price return was 139.29%, with a dividend return of 0%, resulting in a total return of 139.29%.<BR><BR>For the 4-year period, the price return was 274.96%, with a dividend return of 0%, leading to a total return of 274.96%.<BR><BR>Finally, in the 5-year period, the price return was 530.41%, with a dividend return of 0%, resulting in a total return of 530.41%.<BR><BR>Overall, while Shardul Securities Ltd has declared a dividend, the dividend yield is 0%, indicating that there have been no dividends paid in recent periods. The total returns show significant price appreciation over the longer term, despite the lack of dividend income.

View full answer

Who are the top shareholders of the Shardul Sec.?

06-Jun-2025

The top shareholder of Shardul Sec. is Gagan Dinanath Chaturvedi, holding 16.21%, with no pledged promoter holdings. Angular Trading Pvt Ltd is the largest public shareholder at 5.61%, while individual investors own a combined 10.55%.

The top shareholders of Shardul Sec. primarily consist of promoters, with Gagan Dinanath Chaturvedi holding the largest share at 16.21%. There are no pledged promoter holdings, and the company does not have any mutual funds or foreign institutional investors (FIIs) involved. The highest public shareholder is Angular Trading Pvt Ltd, which holds 5.61%. Additionally, individual investors collectively own 10.55% of the company.

View full answer
iScoreScore
Click here to find our call on this stock
Strong Sell
Sell
Hold
Buy
Strong Buy

Dashboard

1

Weak Long Term Fundamental Strength with an average Return on Equity (ROE) of 9.59%

 
2

With ROE of -7.5, it has a Very Expensive valuation with a 0.7 Price to Book Value

stock-summaryMojo Parameters

Mojo Parameters

Loading Valuation Snapshot...

Stock DNA

stock-summary
Industry

Capital Markets

stock-summary
Market cap

INR 450 Cr (Micro Cap)

stock-summary
P/E

19.00

stock-summary
Industry P/E

21

stock-summary
Dividend Yield

0.00%

stock-summary
Debt Equity

0.42

stock-summary
Return on Equity

-7.47%

stock-summary
Price to Book

0.65

Revenue and Profits:
Net Sales:
189 Cr
(Quarterly Results - Jun 2026)
Net Profit:
143 Cr
stock-summaryTotal Returns
Total Returns (Price + Dividend) stock-summary
Dividend Yield (0%)
TimePeriod
Price Return
Dividend Return
Total Return
3 Months
89.22%
0%
89.22%
6 Months
54.6%
0%
54.6%
1 Year
11.03%
0%
11.03%
2 Years
1.32%
0%
1.32%
3 Years
180.84%
0%
180.84%
4 Years
185.52%
0%
185.52%
5 Years
275.0%
0%
275.0%

Latest dividend: 0.6 per share ex-dividend date: Sep-04-2019

Risk Adjusted Returns v/s stock-summary
Returns Beta
Icon
Beta has not been calculated since enough price history is not available
stock-summaryNews & Corporate Actions

Announcements stock-summary

Disclosures under Reg. 29(2) of SEBI (SAST) Regulations 2011

17-Jul-2026 | Source : BSE

The Exchange has received the disclosure under Regulation 29(2) of SEBI (Substantial Acquisition of Shares & Takeovers) Regulations 2011 for Pradeep Sandeep Corporate Advisors LLP & Others

Announcement under Regulation 30 (LODR)-Memorandum of Understanding /Agreements

16-Jul-2026 | Source : BSE

Intimation under Regulations 30 and 30A read with Schedule III of the SEBI (LODR) Regulations 2015.

Announcement under Regulation 30 (LODR)-Newspaper Publication

11-Jul-2026 | Source : BSE

Newspaper publication of Un- Audited Financial Results (Standalone & Consolidated) for the quarter ended 30th June 2026.

Corporate Actions stock-summary

stock-summary
BOARD MEETING

No Upcoming Board Meetings

stock-summary
DIVIDEND

Shardul Securities Ltd has declared 6% dividend, ex-date: 04 Sep 19

stock-summary
SPLITS

Shardul Securities Ltd has announced 2:10 stock split, ex-date: 13 Jan 25

stock-summary
BONUS

No Bonus history available

stock-summary
RIGHTS

No Rights history available

stock-summaryKey Factors

Quality key factors stock-summary

Factor
Value
Sales Growth (5y)
46.04%
EBIT Growth (5y)
21.36%
Net Debt to Equity (avg)
0.42
Institutional Holding
0.30%
ROE (avg)
9.59%

Valuation key factors

Factor
Value
P/E Ratio
19
Industry P/E
21
Price to Book Value
0.68
EV to EBIT
14.32
EV to EBITDA
14.14
EV to Capital Employed
0.76
EV to Sales
4.73
PEG Ratio
0.06
Dividend Yield
NA
ROCE (Latest)
-5.55%
ROE (Latest)
-7.47%

Technicals key factors

Indicator
Weekly
Monthly
MACD
Bullish
Bearish
RSI
Bearish
No Signal
Bollinger Bands
Bullish
Bullish
Moving Averages
Mildly Bearish (Daily)
KST
Bullish
Bearish
Dow Theory
Mildly Bullish
No Trend
OBV
Bullish
Bullish
stock-summary Technical Indicator Scale: Bearish, Mildly Bearish, Sideways, Mildly Bullish, Bullish  Turned 
stock-summaryShareholding
Shareholding Snapshot : Mar 2026stock-summary
Shareholding Compare (%holding) stock-summary
Majority shareholders

Promoters

Pledged Promoter Holdings

None

Mutual Funds

Held by 0 Schemes

FIIs

Held by 1 FIIs (0.3%)

Promoter with highest holding

Gagan Dinanath Chaturvedi (16.21%)

Highest Public shareholder

Angular Trading Pvt Ltd (5.61%)

Individual Investors Holdings

10.21%

stock-summaryFinancial
[
  {
    "link": "quarterly",
    "btn_text": "All Quarterly Results",
    "header": "Quarterly Results Snapshot (Consolidated) - Jun'26 - QoQ",
    "rhs": [
      {
        "prefix": "Net Sales ",
        "suffix": "QoQ Growth in quarter ended Jun 2026 is 4,023.31% vs 135.01% in Mar 2026",
        "dir": 1
      },
      {
        "prefix": "Consolidated Net Profit ",
        "suffix": "QoQ Growth in quarter ended Jun 2026 is 323.83% vs -269.29% in Mar 2026",
        "dir": 1
      }
    ],
    "table": {
      "header": [
        "Jun'26",
        "Mar'26",
        "Change(%)"
      ],
      "body": [
        {
          "field": "Net Sales",
          "val1": "189.26",
          "val2": "4.59",
          "chgp": "4,023.31%",
          "chgp_class": "positive"
        },
        {
          "field": "Operating Profit (PBDIT) excl Other Income",
          "val1": "184.98",
          "val2": "-76.32",
          "chgp": "342.37%",
          "chgp_class": "positive"
        },
        {
          "field": "Interest",
          "val1": "7.76",
          "val2": "5.36",
          "chgp": "44.78%",
          "chgp_class": "negative"
        },
        {
          "field": "Exceptional Items",
          "val1": "0.00",
          "val2": "0.00",
          "chgp": "",
          "chgp_class": "neutral"
        },
        {
          "field": "Consolidate Net Profit",
          "val1": "142.67",
          "val2": "-63.74",
          "chgp": "323.83%",
          "chgp_class": "positive"
        },
        {
          "field": "Operating Profit Margin (Excl OI)",
          "val1": "97.74%",
          "val2": "-1,662.75%",
          "chgp": "1,760.49%",
          "chgp_class": "positive"
        }
      ]
    }
  },
  {
    "link": "half-yearly",
    "btn_text": "All Half Yearly Results",
    "header": "Half Yearly Results Snapshot (Consolidated) - Sep'25",
    "rhs": [
      {
        "prefix": "Net Sales ",
        "suffix": " Growth in half year ended Sep 2025 is -69.59% vs 199.02% in Sep 2024",
        "dir": -1
      },
      {
        "prefix": "Consolidated Net Profit ",
        "suffix": " Growth in half year ended Sep 2025 is -77.65% vs 250.25% in Sep 2024",
        "dir": -1
      }
    ],
    "table": {
      "header": [
        "Sep'25",
        "Sep'24",
        "Change(%)"
      ],
      "body": [
        {
          "field": "Net Sales",
          "val1": "54.83",
          "val2": "180.28",
          "chgp": "-69.59%",
          "chgp_class": "negative"
        },
        {
          "field": "Operating Profit (PBDIT) excl Other Income",
          "val1": "45.07",
          "val2": "172.54",
          "chgp": "-73.88%",
          "chgp_class": "negative"
        },
        {
          "field": "Interest",
          "val1": "5.12",
          "val2": "0.43",
          "chgp": "1,090.70%",
          "chgp_class": "negative"
        },
        {
          "field": "Exceptional Items",
          "val1": "0.00",
          "val2": "0.00",
          "chgp": "",
          "chgp_class": "neutral"
        },
        {
          "field": "Consolidate Net Profit",
          "val1": "31.87",
          "val2": "142.62",
          "chgp": "-77.65%",
          "chgp_class": "negative"
        },
        {
          "field": "Operating Profit Margin (Excl OI)",
          "val1": "82.20%",
          "val2": "95.71%",
          "chgp": "-13.51%",
          "chgp_class": "negative"
        }
      ]
    }
  },
  {
    "link": "nine-monthly",
    "btn_text": "All Nine Monthly Results",
    "header": "Nine Monthly Results Snapshot (Consolidated) - Dec'25",
    "rhs": [
      {
        "prefix": "Net Sales ",
        "suffix": "YoY Growth in nine months ended Dec 2025 is -71.69% vs 23.47% in Dec 2024",
        "dir": -1
      },
      {
        "prefix": "Consolidated Net Profit ",
        "suffix": "YoY Growth in nine months ended Dec 2025 is -85.77% vs 25.69% in Dec 2024",
        "dir": -1
      }
    ],
    "table": {
      "header": [
        "Dec'25",
        "Dec'24",
        "Change(%)"
      ],
      "body": [
        {
          "field": "Net Sales",
          "val1": "41.72",
          "val2": "147.39",
          "chgp": "-71.69%",
          "chgp_class": "negative"
        },
        {
          "field": "Operating Profit (PBDIT) excl Other Income",
          "val1": "28.14",
          "val2": "134.99",
          "chgp": "-79.15%",
          "chgp_class": "negative"
        },
        {
          "field": "Interest",
          "val1": "9.98",
          "val2": "0.66",
          "chgp": "1,412.12%",
          "chgp_class": "negative"
        },
        {
          "field": "Exceptional Items",
          "val1": "0.00",
          "val2": "0.00",
          "chgp": "",
          "chgp_class": "neutral"
        },
        {
          "field": "Consolidate Net Profit",
          "val1": "14.61",
          "val2": "102.68",
          "chgp": "-85.77%",
          "chgp_class": "negative"
        },
        {
          "field": "Operating Profit Margin (Excl OI)",
          "val1": "67.45%",
          "val2": "91.59%",
          "chgp": "-24.14%",
          "chgp_class": "negative"
        }
      ]
    }
  },
  {
    "link": "annual",
    "btn_text": "All Annual Results",
    "header": "Annual Results Snapshot (Consolidated) - Mar'26",
    "rhs": [
      {
        "prefix": "Net Sales ",
        "suffix": "YoY Growth in year ended Mar 2026 is -74.49% vs -63.86% in Mar 2025",
        "dir": -1
      },
      {
        "prefix": "Consolidated Net Profit ",
        "suffix": "YoY Growth in year ended Mar 2026 is -248.95% vs -66.27% in Mar 2025",
        "dir": -1
      }
    ],
    "table": {
      "header": [
        "Mar'26",
        "Mar'25",
        "Change(%)"
      ],
      "body": [
        {
          "field": "Net Sales",
          "val1": "15.98",
          "val2": "62.63",
          "chgp": "-74.49%",
          "chgp_class": "negative"
        },
        {
          "field": "Operating Profit (PBDIT) excl Other Income",
          "val1": "-48.18",
          "val2": "46.40",
          "chgp": "-203.84%",
          "chgp_class": "negative"
        },
        {
          "field": "Interest",
          "val1": "15.33",
          "val2": "1.18",
          "chgp": "1,199.15%",
          "chgp_class": "negative"
        },
        {
          "field": "Exceptional Items",
          "val1": "0.00",
          "val2": "0.00",
          "chgp": "",
          "chgp_class": "neutral"
        },
        {
          "field": "Consolidate Net Profit",
          "val1": "-49.14",
          "val2": "32.99",
          "chgp": "-248.95%",
          "chgp_class": "negative"
        },
        {
          "field": "Operating Profit Margin (Excl OI)",
          "val1": "-301.50%",
          "val2": "74.09%",
          "chgp": "-375.59%",
          "chgp_class": "negative"
        }
      ]
    }
  }
]

Quarterly Results Snapshot (Consolidated) - Jun'26 - QoQstock-summary

Jun'26
Mar'26
Change(%)
Net Sales
189.26
4.59
4,023.31%
Operating Profit (PBDIT) excl Other Income
184.98
-76.32
342.37%
Interest
7.76
5.36
44.78%
Exceptional Items
0.00
0.00
Consolidate Net Profit
142.67
-63.74
323.83%
Operating Profit Margin (Excl OI)
97.74%
-1,662.75%
1,760.49%
Values in Rs Cr.
Direction Arrows
Net Sales

QoQ Growth in quarter ended Jun 2026 is 4,023.31% vs 135.01% in Mar 2026

Direction Arrows
Consolidated Net Profit

QoQ Growth in quarter ended Jun 2026 is 323.83% vs -269.29% in Mar 2026

Half Yearly Results Snapshot (Consolidated) - Sep'25stock-summary

Sep'25
Sep'24
Change(%)
Net Sales
54.83
180.28
-69.59%
Operating Profit (PBDIT) excl Other Income
45.07
172.54
-73.88%
Interest
5.12
0.43
1,090.70%
Exceptional Items
0.00
0.00
Consolidate Net Profit
31.87
142.62
-77.65%
Operating Profit Margin (Excl OI)
82.20%
95.71%
-13.51%
Values in Rs Cr.
Direction Arrows
Net Sales

Growth in half year ended Sep 2025 is -69.59% vs 199.02% in Sep 2024

Direction Arrows
Consolidated Net Profit

Growth in half year ended Sep 2025 is -77.65% vs 250.25% in Sep 2024

Nine Monthly Results Snapshot (Consolidated) - Dec'25stock-summary

Dec'25
Dec'24
Change(%)
Net Sales
41.72
147.39
-71.69%
Operating Profit (PBDIT) excl Other Income
28.14
134.99
-79.15%
Interest
9.98
0.66
1,412.12%
Exceptional Items
0.00
0.00
Consolidate Net Profit
14.61
102.68
-85.77%
Operating Profit Margin (Excl OI)
67.45%
91.59%
-24.14%
Values in Rs Cr.
Direction Arrows
Net Sales

YoY Growth in nine months ended Dec 2025 is -71.69% vs 23.47% in Dec 2024

Direction Arrows
Consolidated Net Profit

YoY Growth in nine months ended Dec 2025 is -85.77% vs 25.69% in Dec 2024

Annual Results Snapshot (Consolidated) - Mar'26stock-summary

Mar'26
Mar'25
Change(%)
Net Sales
15.98
62.63
-74.49%
Operating Profit (PBDIT) excl Other Income
-48.18
46.40
-203.84%
Interest
15.33
1.18
1,199.15%
Exceptional Items
0.00
0.00
Consolidate Net Profit
-49.14
32.99
-248.95%
Operating Profit Margin (Excl OI)
-301.50%
74.09%
-375.59%
Values in Rs Cr.
Direction Arrows
Net Sales

YoY Growth in year ended Mar 2026 is -74.49% vs -63.86% in Mar 2025

Direction Arrows
Consolidated Net Profit

YoY Growth in year ended Mar 2026 is -248.95% vs -66.27% in Mar 2025

stock-summaryCompany CV
About Shardul Securities Ltd stock-summary
stock-summary
Shardul Securities Ltd
Micro Cap
Capital Markets
Shardul Securities Limited was originally incorporated as 'Spotlight Trade & Finance Limited', a public limited company, in July, 1985. In May 1993, the name of the company was changed to Shriyam Securities & Finance Limited and further was changed from Shriyam Securities & Finance Limited to Shardul Securities Limited with effect from 9th January 2003.
Company Coordinates stock-summary
Company Details
G-12 Tulsiani Chambers, 212 Nariman Point Mumbai Maharashtra : 400021
stock-summary
Tel: 91-022-40090500
stock-summary
investors@shriyam.com
Registrar Details
Link Intime India Pvt Ltd, C-13 Pannalal Silk Compound, L B S Marg, Bhandup , Mumbai