
Compare Shardul Sec. with Similar Stocks
Dashboard
With a Operating Losses, the company has a Weak Long Term Fundamental Strength
- Poor long term growth as Operating profit has grown by an annual rate of -218.67%
The company has declared Negative results for the last 3 consecutive quarters
Risky - Negative EBITDA
Underperformed the market in the last 1 year
Stock DNA
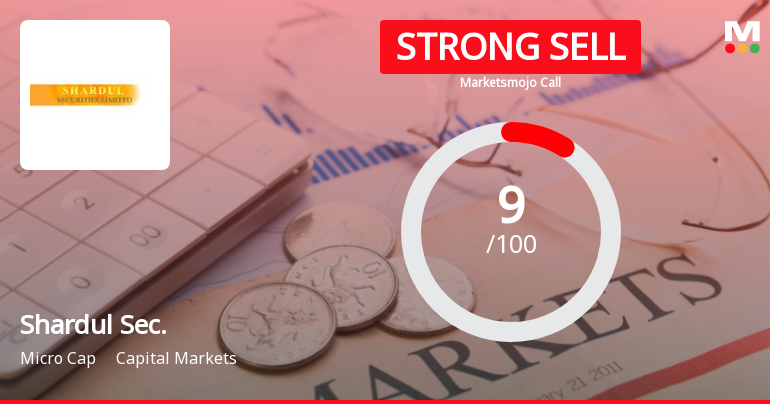
Capital Markets
INR 250 Cr (Micro Cap)
NA (Loss Making)
20
0.00%
0.42
-7.47%
0.39
Total Returns (Price + Dividend) 
Latest dividend: 0.6 per share ex-dividend date: Sep-04-2019
Risk Adjusted Returns v/s
Returns Beta

News
Shardul Securities Ltd Downgraded to Strong Sell Amid Deteriorating Fundamentals and Technicals
Shardul Securities Ltd, a micro-cap player in the capital markets sector, has been assigned a Strong Sell rating with a Mojo Score of 9.0, reflecting significant concerns across quality, valuation, financial trends, and technical indicators. This downgrade follows a comprehensive reassessment of the company’s fundamentals and market performance, signalling caution for investors amid deteriorating financial health and mixed technical signals.
Read full news article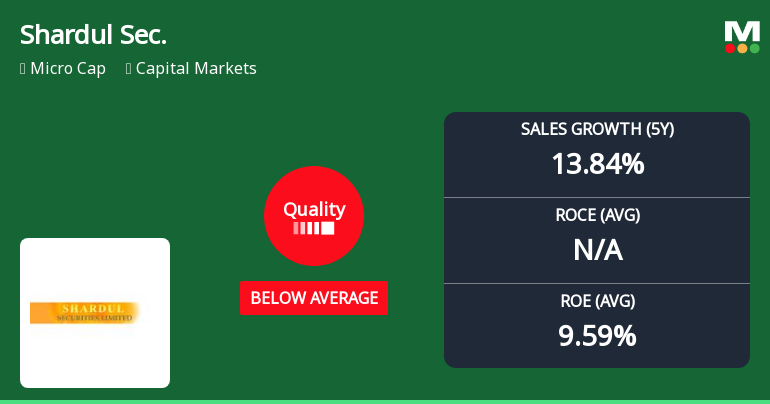
Shardul Securities Ltd Quality Grade Downgrade Highlights Fundamental Challenges
Shardul Securities Ltd, a micro-cap player in the capital markets sector, has recently undergone a significant quality grade downgrade from 'Does Not Qualify' to 'Below Average' as of 29 May 2026. This shift reflects a deterioration in key business fundamentals, including profitability metrics, growth consistency, and leverage, raising concerns about the company’s operational health and investor appeal despite a recent uptick in share price.
Read full news article
Shardul Securities Ltd is Rated Strong Sell
Shardul Securities Ltd is rated Strong Sell by MarketsMOJO, with this rating last updated on 29 May 2026. However, the analysis and financial metrics discussed here reflect the stock’s current position as of 30 May 2026, providing investors with the latest insights into the company’s performance and outlook.
Read full news article Announcements
Announcement under Regulation 30 (LODR)-Newspaper Publication
29-May-2026 | Source : BSENewspaper publication of Financial Results (Standalone and Consolidated) for the quarter and year ended 31st March 2026.
Board Meeting Intimation for Consideration And Approval Of Audited Financial Results (Standalone And Consolidated) For The Quarter And Year Ended 31St March 2026
21-May-2026 | Source : BSEShardul Securities Ltdhas informed BSE that the meeting of the Board of Directors of the Company is scheduled on 27/05/2026 inter alia to consider and approve Audited Financial Results (Standalone and Consolidated) for the quarter and year ended 31st March 2026
Format of the Initial Disclosure to be made by an entity identified as a Large Corporate : Annexure A
29-Apr-2026 | Source : BSEFormat of Initial Disclosure to be made by an entity identified as a Large Corporate.
| Sr. No. | Particulars | Details |
| 1 | Name of Company | Shardul Securities Ltd |
| 2 | CIN NO. | L50100MH1985PLC036937 |
| 3 | Outstanding borrowing of company as on 31st March / 31st December as applicable (in Rs cr) | 274.00 |
| 4 | Highest Credit Rating during the previous FY | NA |
| 4a | Name of the Credit Rating Agency issuing the Credit Rating mentioned in (4) | Not Applicable |
| 5 | Name of Stock Exchange# in which the fine shall be paid in case of shortfall in the required borrowing under the framework | BSE |
Designation: Company Secretary and Compliance Officer
EmailId: daya@ssl.ind.in
Designation: CFO
EmailId: tarun@ssl.ind.in
Date: 29/04/2026
Note: In terms para of 3.2(ii) of the circular beginning F.Y 2022 in the event of shortfall in the mandatory borrowing through debt securities a fine of 0.2% of the shortfall shall be levied by Stock Exchanges at the end of the two-year block period. Therefore an entity identified as LC shall provide in its initial disclosure for a financial year the name of Stock Exchange to which it would pay the fine in case of shortfall in the mandatory borrowing through debt markets.
Corporate Actions

No Upcoming Board Meetings

Shardul Securities Ltd has declared 6% dividend, ex-date: 04 Sep 19

Shardul Securities Ltd has announced 2:10 stock split, ex-date: 13 Jan 25

No Bonus history available

No Rights history available
Quality key factors
Valuation key factors
Technicals key factors
 Technical Indicator Scale: Bearish, Mildly Bearish, Sideways, Mildly Bullish, Bullish Turned
 Shareholding Snapshot : Mar 2026
Shareholding Compare (%holding)
Promoters
None
Held by 0 Schemes
Held by 1 FIIs (0.3%)
Gagan Dinanath Chaturvedi (16.21%)
Angular Trading Pvt Ltd (5.61%)
10.21%
Quarterly Results Snapshot (Consolidated) - Mar'26 - QoQ

QoQ Growth in quarter ended Mar 2026 is 135.01% vs 66.65% in Dec 2025

QoQ Growth in quarter ended Mar 2026 is -269.29% vs 55.17% in Dec 2025
Half Yearly Results Snapshot (Consolidated) - Sep'25
Growth in half year ended Sep 2025 is -69.59% vs 199.02% in Sep 2024
Growth in half year ended Sep 2025 is -77.65% vs 250.25% in Sep 2024
Nine Monthly Results Snapshot (Consolidated) - Dec'25
YoY Growth in nine months ended Dec 2025 is -71.69% vs 23.47% in Dec 2024
YoY Growth in nine months ended Dec 2025 is -85.77% vs 25.69% in Dec 2024
Annual Results Snapshot (Consolidated) - Mar'26
YoY Growth in year ended Mar 2026 is -74.49% vs -63.86% in Mar 2025
YoY Growth in year ended Mar 2026 is -248.95% vs -66.27% in Mar 2025
About Shardul Securities Ltd

Company Coordinates


