
Compare Shashijit Infra. with Similar Stocks
Dashboard
Weak Long Term Fundamental Strength with an average Return on Capital Employed (ROCE) of 3.47%
- Poor long term growth as Net Sales has grown by an annual rate of 6.86% and Operating profit at 4.40% over the last 5 years
- Low ability to service debt as the company has a high Debt to EBITDA ratio of 7.15 times
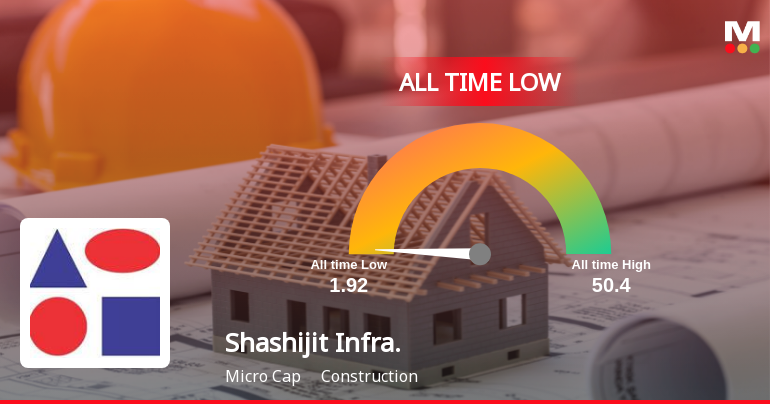
Flat results in Mar 26
Consistent Underperformance against the benchmark over the last 3 years
Total Returns (Price + Dividend) 
Latest dividend: 0 per share ex-dividend date: Sep-20-2019
Risk Adjusted Returns v/s
Returns Beta

News

Shashijit Infraprojects Ltd Upgraded to Sell Amid Mixed Technical and Fundamental Signals
Shashijit Infraprojects Ltd has seen its investment rating upgraded from Strong Sell to Sell as of 15 July 2026, driven primarily by a shift in technical indicators despite persistent fundamental weaknesses. The construction sector stock’s Mojo Score improved to 31.0, reflecting a mild easing of bearish trends, though long-term financial metrics continue to weigh on investor sentiment.
Read full news article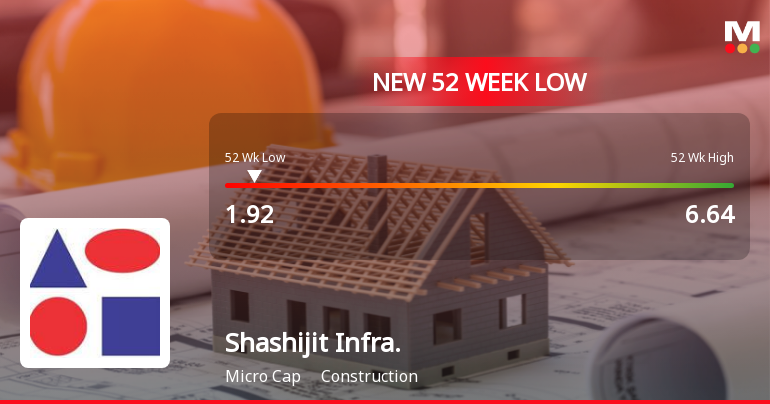
Announcements
Disclosure Under Regulation 30 Of SEBI (LODR) - Update On Ongoing Matter Before The Honble High Court Of Gujarat
27-Jul-2026 | Source : BSEIntimation regarding ongoing matter before the Honble High Court of Gujarat in the matter of dispute related to the leased properties acquired from Vapi Municipal Corporation
Compliances-Certificate under Reg. 74 (5) of SEBI (DP) Regulations 2018
14-Jul-2026 | Source : BSEAttached Certificate under Reg 74(5) of SEBI (DP) Regulations 2018 for the quarter ended 30.06.2026
Disclosure Under Regulation 30 Of SEBI (LODR) - Update On Ongoing Matter Before The Honble High Court Of Gujarat
07-Jul-2026 | Source : BSEIntimation regarding update on ongoing matter before the Honble High Court of Gujarat in the matter of dispute related to leased properties acquired from Vapi Municipal Corporation
Corporate Actions

No Upcoming Board Meetings


Shashijit Infraprojects Ltd has announced 2:10 stock split, ex-date: 27 Oct 23

Shashijit Infraprojects Ltd has announced 1:5 bonus issue, ex-date: 12 Oct 18

No Rights history available
Quality key factors
Valuation key factors
Technicals key factors
 Technical Indicator Scale: Bearish, Mildly Bearish, Sideways, Mildly Bullish, Bullish Turned
 Shareholding Snapshot : Jun 2026
Shareholding Compare (%holding)
Non Institution
None
Held by 0 Schemes
Held by 0 FIIs
Ajitkumar Deepchand Jain (18.02%)
Rajesh Kumar Sodhani (12.38%)
53.45%
Quarterly Results Snapshot (Standalone) - Mar'26 - YoY

YoY Growth in quarter ended Mar 2026 is 21.35% vs -18.21% in Mar 2025
YoY Growth in quarter ended Mar 2026 is 120.22% vs -74.51% in Mar 2025
Half Yearly Results Snapshot (Standalone) - Sep'25
Growth in half year ended Sep 2025 is 3.88% vs -13.56% in Sep 2024
Growth in half year ended Sep 2025 is 161.54% vs -218.18% in Sep 2024
Nine Monthly Results Snapshot (Standalone) - Dec'25
YoY Growth in nine months ended Dec 2025 is -3.39% vs -15.75% in Dec 2024
YoY Growth in nine months ended Dec 2025 is 109.77% vs -424.39% in Dec 2024
Annual Results Snapshot (Standalone) - Mar'26
YoY Growth in year ended Mar 2026 is 2.49% vs -16.38% in Mar 2025
YoY Growth in year ended Mar 2026 is 115.76% vs -409.84% in Mar 2025
About Shashijit Infraprojects Ltd

Company Coordinates


