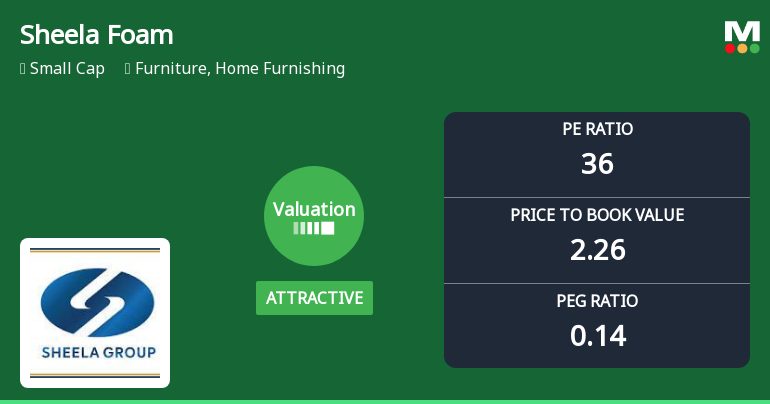
Sheela Foam

  • Market Cap: Small Cap
  • Industry: Furniture, Home Furnishing
  • ISIN: INE916U01025
  • NSEID: SFL
  • BSEID: 540203
INR
646.55
-9.6 (-1.46%)
BSENSE

Aug 25, 03:56 PM

BSE+NSE Vol: 1.37 lacs

  • Price Points
  • Score
  • Mojo Parameters
  • Total Return
  • News and Corporate Actions
  • Key factors
  • Shareholding
  • Financials
  • CompanyCV
stock-summaryPrice Point
High/Low

1Day

52 Week

Valuation
Technical
Day's Volume

CASH

1.37 lacs (17.75%) Volume

Shareholding (Jun 2026)

FII

4.17%

Held by 96 FIIs

DII

18.52%

Held by 20 DIIs

Promoter

65.39%

Why is Sheela Foam Ltd. falling/rising?

25-Aug-2026

As of 24-Aug, Sheela Foam Ltd. is experiencing a decline in its stock price, currently at 656.55, reflecting a drop of -1.33%. This decline is due to underperformance against its sector, reduced investor participation, and poor long-term growth, despite some positive indicators.

As of 24-Aug, Sheela Foam Ltd. is experiencing a decline in its stock price, currently at 656.55, which reflects a change of -8.85 (-1.33%). This downward movement can be attributed to several factors. The stock has underperformed its sector by 0.9% today and has been on a consecutive decline for the last three days, accumulating a total drop of 3.5% during this period. Additionally, the stock's performance over the past week shows a decrease of 2.73%, while the benchmark Sensex has only fallen by 0.46%.<BR><BR>Investor participation has also waned, as indicated by a significant drop in delivery volume, which fell by 41.38% compared to the five-day average. This decline in trading activity suggests a lack of confidence among investors. Although the stock is trading above its 100-day and 200-day moving averages, it is below its 5-day, 20-day, and 50-day moving averages, indicating a short-term bearish trend.<BR><BR>Moreover, the company has shown poor long-term growth, with an annual operating profit decline of 2.67% over the past five years. This consistent underperformance against benchmarks over the last three years, including a 6.33% return drop in the past year, further exacerbates the negative sentiment surrounding the stock. While there are positive indicators such as a high growth in net profit and attractive valuations, the prevailing trends and recent performance suggest that Sheela Foam Ltd. is currently facing challenges that are contributing to its falling stock price.

View full answer

Who are in the management team of Sheela Foam?

14-Aug-2026

The management team of Sheela Foam includes Chairman Rahul Gautam, Managing Director Tushaar Gautam, and Whole-time Directors Namita Gautam and Rakesh Chahar, along with several independent directors and Company Secretary Md Iquebal Ahmad, who collectively guide the company's strategic direction.

The management team of Sheela Foam includes the following key members:<BR><BR>1. **Rahul Gautam** - Chairman & Whole-time Director<BR>2. **Tushaar Gautam** - Managing Director<BR>3. **Namita Gautam** - Whole-time Director<BR>4. **Rakesh Chahar** - Whole-time Director<BR><BR>Additionally, the board features several independent directors:<BR><BR>1. **Ravindra Dhariwal** - Independent Director<BR>2. **Som Mittal** - Independent Director<BR>3. **Anil Tandon** - Independent Director<BR>4. **Vijay Kumar Ahluwalia** - Independent Director<BR>5. **Meena Jagtiani** - Independent Director<BR><BR>Lastly, **Md Iquebal Ahmad** serves as the Company Secretary and Compliance Officer. This diverse team plays a crucial role in guiding the company's strategic direction and governance.

View full answer

What does Sheela Foam do?

14-Aug-2026

Sheela Foam Ltd. is a leading Indian manufacturer of polyurethane foams, primarily in the mattress and home furnishing sector, with a market cap of INR 7,568 Cr. As of June 2026, it reported net sales of 1,032 Cr and a net profit of 61 Cr.

Overview: <BR>Sheela Foam Ltd. is a leading manufacturer of polyurethane foams in India, operating in the Furniture and Home Furnishing industry within the Small Cap market-cap bracket.<BR><BR>History: <BR>Sheela Foam Ltd. is the flagship company of Sheela Group and has established itself as a pioneer in the mattress and foam industry. The latest quarterly results reported net sales and net profit for the period ending June 2026.<BR><BR>Financial Snapshot: <BR>Most recent Net Sales: 1,032 Cr (Quarterly Results - Jun 2026) <BR>Most recent Net Profit: 61 Cr (Quarterly Results - Jun 2026) <BR>Market-cap value: INR 7,568 Cr (Small Cap)<BR><BR>Key Metrics: <BR>P/E: 38.00 <BR>Industry P/E: 45 <BR>Dividend Yield: 0.14% <BR>Debt-Equity: 0.23 <BR>Return on Equity: 4.66% <BR>Price to Book: 2.32 <BR><BR>Contact Details: <BR>Address: C-55 Preet Vihar, New Delhi Delhi: 110092 <BR>Phone: 91-11-22026875 <BR>Email: iquebal.ahmed@sheelafoam.com <BR>Website: http://www.sheelafoam.com

View full answer

Who are the peers of the Sheela Foam?

14-Aug-2026

Sheela Foam's peers include Milestone Furn., Responsive Ind., BirlaNu Ltd, Stanley Lifesty., Hardwyn India, Tirupati Foam, Safe Enterprises, and Rexpro Enter. In terms of management risk and growth, Sheela Foam is rated average, with a 1-year return of 3.65%, significantly lower than Milestone Furn.'s 156.81%.

Peers: The peers of Sheela Foam are Milestone Furn., Responsive Ind, BirlaNu Ltd, Stanley Lifesty., Hardwyn India, Tirupati Foam, Safe Enterprises, and Rexpro Enter.<BR><BR>Quality Snapshot: Excellent management risk is observed at Hardwyn India and Safe Enterprises, while Average management risk is found at Sheela Foam, Responsive Ind, Stanley Lifesty., Tirupati Foam, and the rest. Below Average management risk is noted at BirlaNu Ltd and Rexpro Enter. Growth is Excellent at Safe Enterprises, while Average growth is seen at Sheela Foam, Responsive Ind, Stanley Lifesty., Hardwyn India, Tirupati Foam, and the rest. Below Average growth is reported for BirlaNu Ltd and Rexpro Enter. In terms of Capital Structure, Excellent is noted at Hardwyn India, Good at Sheela Foam, Responsive Ind, and Rexpro Enter, while Average is found at Stanley Lifesty. and Below Average at BirlaNu Ltd and Tirupati Foam.<BR><BR>Return Snapshot: The peer with the highest 1-year return is Milestone Furn. at 156.81%, while the lowest is Responsive Ind at -15.53%. Sheela Foam's 1-year return is 3.65%, which is higher than Responsive Ind but significantly lower than Milestone Furn. Additionally, the six-month return is negative for Milestone Furn., Responsive Ind, Hardwyn India, and BirlaNu Ltd.

View full answer

How big is Sheela Foam?

14-Aug-2026

As of 14th August, Sheela Foam Ltd. has a market capitalization of 7,628.40 Cr, with recent net sales of 4,031.37 Cr and a net profit of 214.51 Cr.

As of 14th August, Sheela Foam Ltd. has a market capitalization of 7,628.40 Cr, categorizing it as a Small Cap company.<BR><BR>In the latest four quarters, Sheela Foam reported Net Sales of 4,031.37 Cr and a Net Profit of 214.51 Cr.<BR><BR>The latest annual period for the balance sheet is March 2026, with Shareholder's Funds amounting to 3,251.96 Cr and Total Assets of 5,002.28 Cr.

View full answer

Should I buy, sell or hold Sheela Foam Ltd.?

08-Aug-2026

Are Sheela Foam Ltd. latest results good or bad?

05-Aug-2026

Sheela Foam Ltd.'s latest results show strong year-on-year revenue growth of 25.63% and a significant net profit increase of 839.45%, indicating strong demand. However, there are concerns with a 32.69% decline in net profit and slight contraction in operating margins compared to the previous quarter, suggesting challenges in maintaining profitability.

Sheela Foam Ltd.'s latest results present a mixed picture. On one hand, the company reported strong year-on-year revenue growth of 25.63%, reaching ₹1,031.94 crores, and a remarkable net profit increase of 839.45% to ₹61.44 crores compared to the same quarter last year. This indicates a significant recovery and strong demand for their products, particularly under the Sleepwell brand.<BR><BR>However, there are concerns regarding the sequential performance. The net profit saw a decline of 32.69% compared to the previous quarter, and operating margins also contracted slightly from 11.11% to 10.55%. This suggests that while the company is experiencing robust annual growth, it faces challenges in maintaining profitability on a quarter-to-quarter basis, possibly due to rising input costs or competitive pressures.<BR><BR>Overall, while the year-on-year performance is impressive and indicates a positive trend, the sequential declines in profitability and margins raise questions about the sustainability of this turnaround. Investors should approach with cautious optimism, keeping an eye on the company's ability to stabilize margins and improve operational efficiency in the coming quarters.

View full answer

When is the next results date for Sheela Foam Ltd.?

12-May-2026

The next results date for Sheela Foam Ltd. is 14 May 2026.

The next results date for Sheela Foam Ltd. is scheduled for 14 May 2026.

View full answer

Is Sheela Foam overvalued or undervalued?

18-Nov-2025

As of November 17, 2025, Sheela Foam is considered overvalued with a high PE ratio of 113.25, significantly exceeding peers like V-Guard Industries and Bata India, and has underperformed the Sensex with a year-to-date decline of 35.59%.

As of 17 November 2025, the valuation grade for Sheela Foam has moved from very attractive to attractive, indicating a shift in market perception. The company is currently considered overvalued based on its high valuation ratios, including a PE ratio of 113.25, an EV to EBIT of 85.93, and an EV to EBITDA of 28.01. These figures suggest that the stock is trading at a premium compared to its earnings and operational performance.<BR><BR>In comparison to peers, Sheela Foam's PE ratio significantly exceeds that of V-Guard Industries at 52.83 and Bata India at 69.25, both of which are also rated as attractive. This disparity highlights that Sheela Foam may be overextended in its valuation relative to its industry counterparts. Additionally, the company's recent stock performance has lagged behind the Sensex, with a year-to-date decline of 35.59% compared to the Sensex's gain of 8.72%. This further reinforces the notion that Sheela Foam is overvalued in the current market environment.

View full answer

Is Sheela Foam technically bullish or bearish?

11-Nov-2025

As of November 10, 2025, Sheela Foam's technical trend is bearish with moderate strength, driven by bearish daily moving averages and Bollinger Bands, despite a mildly bullish MACD on longer time frames.

As of 10 November 2025, the technical trend has changed from mildly bearish to bearish. The current technical stance for Sheela Foam is bearish with moderate strength. Key indicators driving this stance include the daily moving averages showing bearish signals, and the weekly and monthly Bollinger Bands and KST also indicating bearish trends. While the MACD is mildly bullish on both weekly and monthly time frames, it is overshadowed by the overall bearish signals from other indicators. The stock has underperformed significantly compared to the Sensex over various periods, further supporting the bearish outlook.

View full answer

How has been the historical performance of Sheela Foam?

06-Nov-2025

Sheela Foam has experienced steady growth in net sales and total assets, increasing from 2,173.63 Cr in Mar'20 to 3,439.19 Cr in Mar'25. However, profitability has declined significantly, with profit after tax dropping from 240.16 Cr in Mar'21 to 88.90 Cr in Mar'25, alongside a decrease in earnings per share from 48.74 to 8.22.

Answer:<BR>The historical performance of Sheela Foam shows a fluctuating trend in key financial metrics over the years.<BR><BR>Breakdown:<BR>Sheela Foam's net sales have increased from 2,173.63 Cr in Mar'20 to 3,439.19 Cr in Mar'25, reflecting a steady growth trajectory. However, total operating income followed a similar trend, reaching 3,439.19 Cr in Mar'25 from 2,141.45 Cr in Mar'19. The raw material costs also rose significantly, from 1,088.10 Cr in Mar'20 to 1,980.17 Cr in Mar'25, impacting the operating profit, which decreased from 364.16 Cr in Mar'21 to 244.95 Cr in Mar'25. Profit before tax showed a decline from 323.85 Cr in Mar'21 to 103.31 Cr in Mar'25, while profit after tax fell from 240.16 Cr in Mar'21 to 88.90 Cr in Mar'25. The earnings per share (EPS) decreased from 48.74 in Mar'21 to 8.22 in Mar'25, indicating a significant drop in profitability. Total liabilities increased from 1,651.30 Cr in Mar'20 to 5,217.87 Cr in Mar'25, with total assets also rising to 5,217.87 Cr in Mar'25. Cash flow from operating activities decreased from 405.00 Cr in Mar'24 to 252.00 Cr in Mar'25, while cash flow from investing activities showed a substantial outflow of -2,258.00 Cr in Mar'24, indicating significant investment activity. Overall, while Sheela Foam has seen growth in sales and assets, profitability and cash flow have faced challenges in recent years.

View full answer

Who are the top shareholders of the Sheela Foam?

06-Jun-2025

The top shareholders of Sheela Foam include Tushaar Gautam, who holds 31.46%, followed by mutual funds at 18.03%, with SBI Magnum Midcap Fund as the largest public shareholder at 9.78%. Foreign Institutional Investors hold 6.23%, and individual investors account for 4.94%, with no pledged promoter holdings.

The top shareholders of Sheela Foam include the promoters, with Tushaar Gautam holding the highest stake at 31.46%. Additionally, mutual funds collectively hold 18.03% of the company, with the SBI Magnum Midcap Fund being the largest public shareholder at 9.78%. Foreign Institutional Investors (FIIs) hold 6.23%, and individual investors account for 4.94%. Notably, there are no pledged promoter holdings.

View full answer

What is the bonus history of the Sheela Foam?

06-Jun-2025

Sheela Foam's recent bonus history includes a 1:1 bonus issue announced on December 21, 2022, with a record date of December 22, 2022, allowing shareholders to receive one additional share for each share held.

Sheela Foam has a recent bonus history that includes a 1:1 bonus issue announced with an ex-date of December 21, 2022. The record date for this bonus was December 22, 2022. This means that shareholders received one additional share for every share they held as of the record date.

View full answer

Has Sheela Foam declared dividend?

06-Jun-2025

No Dividend History Available

iScoreScore
Part of MojoOne Strategy
Click here to find our call on this stock
Strong Sell
Sell
Hold
Buy
Strong Buy

Dashboard

1

Company has a Debt to Equity ratio (avg) of 0.25 times

 
2

With a growth in Net Profit of 1126.29%, the company declared Very Positive results in Jun 26

3

With ROCE of 5.4, it has a Attractive valuation with a 2 Enterprise value to Capital Employed

4

High Institutional Holdings at 22.69%

stock-summaryMojo Parameters

Mojo Parameters

Loading Valuation Snapshot...

Stock DNA

stock-summary
Industry

Furniture, Home Furnishing

stock-summary
Market cap

INR 7,061 Cr (Small Cap)

stock-summary
P/E

35.00

stock-summary
Industry P/E

NA

stock-summary
Dividend Yield

0.15%

stock-summary
Debt Equity

0.23

stock-summary
Return on Equity

4.66%

stock-summary
Price to Book

2.20

Revenue and Profits:
Net Sales:
1,032 Cr
(Quarterly Results - Jun 2026)
Net Profit:
61 Cr
stock-summaryTotal Returns
Total Returns (Price + Dividend) stock-summary
Dividend Yield (0.15%)
TimePeriod
Price Return
Dividend Return
Total Return
3 Months
1.81%
0.16%
1.97%
6 Months
16.93%
0.18%
17.11%
1 Year
-8.98%
0.14%
-8.84%
2 Years
-31.18%
0.11%
-31.07%
3 Years
-41.6%
0.09%
-41.51%
4 Years
-56.13%
0.07%
-56.06%
5 Years
-44.84%
0.09%
-44.75%

Latest dividend: 1 per share ex-dividend date: Jul-09-2026

Risk Adjusted Returns v/s stock-summary
Returns Beta
Icon
Beta has not been calculated since enough price history is not available
stock-summaryNews & Corporate Actions

News

Sheela Foam Ltd Gains 3.36%: Mixed Signals Shape Weekly Momentum

Announcements stock-summary

Sheela Foam Limited - Other General Purpose

22-Nov-2019 | Source : NSE

Sheela Foam Limited has informed the Exchange regarding Disclosure of Related Party Transactions pursuant to Regulation 23(9) of the SEBI (Listing Obligations and Disclosure Requirements) Regulations 2015.

Sheela Foam Limited - Appointment

13-Nov-2019 | Source : NSE

Sheela Foam Limited has informed the Exchange regarding Appointment of Mr Dhruv chandra mathur as Chief Financial Officer of the company w.e.f. November 11, 2019.

Sheela Foam Limited - Acquisition

16-Oct-2019 | Source : NSE

Sheela Foam Limited has informed the Exchange about Acquisition

Corporate Actions stock-summary

stock-summary
BOARD MEETING

No Upcoming Board Meetings

stock-summary
DIVIDEND

Sheela Foam Ltd. has declared 20% dividend, ex-date: 09 Jul 26

stock-summary
SPLITS

No Splits history available

stock-summary
BONUS

Sheela Foam Ltd. has announced 1:1 bonus issue, ex-date: 21 Dec 22

stock-summary
RIGHTS

No Rights history available

stock-summaryKey Factors

Quality key factors stock-summary

Factor
Value
Sales Growth (5y)
8.21%
EBIT Growth (5y)
-2.67%
EBIT to Interest (avg)
5.92
Debt to EBITDA (avg)
3.06
Net Debt to Equity (avg)
0.23
Sales to Capital Employed (avg)
1.10
Tax Ratio
23.00%
Dividend Payout Ratio
6.84%
Pledged Shares
0
Institutional Holding
22.69%
ROCE (avg)
8.93%
ROE (avg)
8.11%

Valuation key factors

Factor
Value
P/E Ratio
35
Industry P/E
0
Price to Book Value
2.20
EV to EBIT
30.23
EV to EBITDA
18.46
EV to Capital Employed
1.98
EV to Sales
1.96
PEG Ratio
0.14
Dividend Yield
0.15%
ROCE (Latest)
5.38%
ROE (Latest)
4.66%

Technicals key factors

Indicator
Weekly
Monthly
MACD
Mildly Bearish
Mildly Bullish
RSI
No Signal
No Signal
Bollinger Bands
Bearish
Sideways
Moving Averages
Mildly Bullish (Daily)
KST
Mildly Bearish
Mildly Bullish
Dow Theory
Mildly Bearish
Mildly Bullish
OBV
No Trend
Bullish
stock-summary Technical Indicator Scale: Bearish, Mildly Bearish, Sideways, Mildly Bullish, Bullish  Turned 
stock-summaryShareholding
Shareholding Snapshot : Jun 2026stock-summary
Shareholding Compare (%holding) stock-summary
Majority shareholders

Promoters

Pledged Promoter Holdings

None

Mutual Funds

Held by 11 Schemes (15.83%)

FIIs

Held by 96 FIIs (4.17%)

Promoter with highest holding

Rahul Gautam (47.34%)

Highest Public shareholder

Sbi Elss Tax Saver Fund (8.54%)

Individual Investors Holdings

8.56%

stock-summaryFinancial
[
  {
    "link": "quarterly",
    "btn_text": "All Quarterly Results",
    "header": "Quarterly Results Snapshot (Consolidated) - Jun'26 - YoY",
    "rhs": [
      {
        "prefix": "Net Sales ",
        "suffix": "YoY Growth in quarter ended Jun 2026 is 25.63% vs 1.44% in Jun 2025",
        "dir": 1
      },
      {
        "prefix": "Consolidated Net Profit ",
        "suffix": "YoY Growth in quarter ended Jun 2026 is 839.45% vs -85.79% in Jun 2025",
        "dir": 1
      }
    ],
    "table": {
      "header": [
        "Jun'26",
        "Jun'25",
        "Change(%)"
      ],
      "body": [
        {
          "field": "Net Sales",
          "val1": "1,031.94",
          "val2": "821.41",
          "chgp": "25.63%",
          "chgp_class": "positive"
        },
        {
          "field": "Operating Profit (PBDIT) excl Other Income",
          "val1": "108.90",
          "val2": "75.23",
          "chgp": "44.76%",
          "chgp_class": "positive"
        },
        {
          "field": "Interest",
          "val1": "17.82",
          "val2": "29.17",
          "chgp": "-38.91%",
          "chgp_class": "positive"
        },
        {
          "field": "Exceptional Items",
          "val1": "6.26",
          "val2": "0.00",
          "chgp": "",
          "chgp_class": "neutral"
        },
        {
          "field": "Consolidate Net Profit",
          "val1": "61.44",
          "val2": "6.54",
          "chgp": "839.45%",
          "chgp_class": "positive"
        },
        {
          "field": "Operating Profit Margin (Excl OI)",
          "val1": "10.55%",
          "val2": "9.16%",
          "chgp": "1.39%",
          "chgp_class": "positive"
        }
      ]
    }
  },
  {
    "link": "half-yearly",
    "btn_text": "All Half Yearly Results",
    "header": "Half Yearly Results Snapshot (Consolidated) - Sep'25",
    "rhs": [
      {
        "prefix": "Net Sales ",
        "suffix": " Growth in half year ended Sep 2025 is 4.55% vs 28.95% in Sep 2024",
        "dir": -1
      },
      {
        "prefix": "Consolidated Net Profit ",
        "suffix": " Growth in half year ended Sep 2025 is -72.80% vs -31.58% in Sep 2024",
        "dir": -1
      }
    ],
    "table": {
      "header": [
        "Sep'25",
        "Sep'24",
        "Change(%)"
      ],
      "body": [
        {
          "field": "Net Sales",
          "val1": "1,696.35",
          "val2": "1,622.48",
          "chgp": "4.55%",
          "chgp_class": "positive"
        },
        {
          "field": "Operating Profit (PBDIT) excl Other Income",
          "val1": "162.36",
          "val2": "130.18",
          "chgp": "24.72%",
          "chgp_class": "positive"
        },
        {
          "field": "Interest",
          "val1": "57.24",
          "val2": "56.51",
          "chgp": "1.29%",
          "chgp_class": "negative"
        },
        {
          "field": "Exceptional Items",
          "val1": "-7.84",
          "val2": "30.62",
          "chgp": "-125.60%",
          "chgp_class": "negative"
        },
        {
          "field": "Consolidate Net Profit",
          "val1": "16.20",
          "val2": "59.56",
          "chgp": "-72.80%",
          "chgp_class": "negative"
        },
        {
          "field": "Operating Profit Margin (Excl OI)",
          "val1": "9.57%",
          "val2": "8.02%",
          "chgp": "1.55%",
          "chgp_class": "positive"
        }
      ]
    }
  },
  {
    "link": "nine-monthly",
    "btn_text": "All Nine Monthly Results",
    "header": "Nine Monthly Results Snapshot (Consolidated) - Dec'25",
    "rhs": [
      {
        "prefix": "Net Sales ",
        "suffix": "YoY Growth in nine months ended Dec 2025 is 7.00% vs 21.17% in Dec 2024",
        "dir": -1
      },
      {
        "prefix": "Consolidated Net Profit ",
        "suffix": "YoY Growth in nine months ended Dec 2025 is -10.41% vs -35.27% in Dec 2024",
        "dir": 1
      }
    ],
    "table": {
      "header": [
        "Dec'25",
        "Dec'24",
        "Change(%)"
      ],
      "body": [
        {
          "field": "Net Sales",
          "val1": "2,770.78",
          "val2": "2,589.59",
          "chgp": "7.00%",
          "chgp_class": "positive"
        },
        {
          "field": "Operating Profit (PBDIT) excl Other Income",
          "val1": "276.75",
          "val2": "218.25",
          "chgp": "26.80%",
          "chgp_class": "positive"
        },
        {
          "field": "Interest",
          "val1": "74.27",
          "val2": "85.27",
          "chgp": "-12.90%",
          "chgp_class": "positive"
        },
        {
          "field": "Exceptional Items",
          "val1": "-7.84",
          "val2": "30.62",
          "chgp": "-125.60%",
          "chgp_class": "negative"
        },
        {
          "field": "Consolidate Net Profit",
          "val1": "68.33",
          "val2": "76.27",
          "chgp": "-10.41%",
          "chgp_class": "negative"
        },
        {
          "field": "Operating Profit Margin (Excl OI)",
          "val1": "9.99%",
          "val2": "8.43%",
          "chgp": "1.56%",
          "chgp_class": "positive"
        }
      ]
    }
  },
  {
    "link": "annual",
    "btn_text": "All Annual Results",
    "header": "Annual Results Snapshot (Consolidated) - Mar'26",
    "rhs": [
      {
        "prefix": "Net Sales ",
        "suffix": "YoY Growth in year ended Mar 2026 is 11.10% vs 15.32% in Mar 2025",
        "dir": -1
      },
      {
        "prefix": "Consolidated Net Profit ",
        "suffix": "YoY Growth in year ended Mar 2026 is 78.63% vs -51.02% in Mar 2025",
        "dir": 1
      }
    ],
    "table": {
      "header": [
        "Mar'26",
        "Mar'25",
        "Change(%)"
      ],
      "body": [
        {
          "field": "Net Sales",
          "val1": "3,820.84",
          "val2": "3,439.20",
          "chgp": "11.10%",
          "chgp_class": "positive"
        },
        {
          "field": "Operating Profit (PBDIT) excl Other Income",
          "val1": "393.37",
          "val2": "244.98",
          "chgp": "60.57%",
          "chgp_class": "positive"
        },
        {
          "field": "Interest",
          "val1": "95.15",
          "val2": "120.55",
          "chgp": "-21.07%",
          "chgp_class": "positive"
        },
        {
          "field": "Exceptional Items",
          "val1": "7.93",
          "val2": "30.59",
          "chgp": "-74.08%",
          "chgp_class": "negative"
        },
        {
          "field": "Consolidate Net Profit",
          "val1": "159.61",
          "val2": "89.35",
          "chgp": "78.63%",
          "chgp_class": "positive"
        },
        {
          "field": "Operating Profit Margin (Excl OI)",
          "val1": "10.30%",
          "val2": "7.12%",
          "chgp": "3.18%",
          "chgp_class": "positive"
        }
      ]
    }
  }
]

Quarterly Results Snapshot (Consolidated) - Jun'26 - YoYstock-summary

Jun'26
Jun'25
Change(%)
Net Sales
1,031.94
821.41
25.63%
Operating Profit (PBDIT) excl Other Income
108.90
75.23
44.76%
Interest
17.82
29.17
-38.91%
Exceptional Items
6.26
0.00
Consolidate Net Profit
61.44
6.54
839.45%
Operating Profit Margin (Excl OI)
10.55%
9.16%
1.39%
Values in Rs Cr.
Direction Arrows
Net Sales

YoY Growth in quarter ended Jun 2026 is 25.63% vs 1.44% in Jun 2025

Direction Arrows
Consolidated Net Profit

YoY Growth in quarter ended Jun 2026 is 839.45% vs -85.79% in Jun 2025

Half Yearly Results Snapshot (Consolidated) - Sep'25stock-summary

Sep'25
Sep'24
Change(%)
Net Sales
1,696.35
1,622.48
4.55%
Operating Profit (PBDIT) excl Other Income
162.36
130.18
24.72%
Interest
57.24
56.51
1.29%
Exceptional Items
-7.84
30.62
-125.60%
Consolidate Net Profit
16.20
59.56
-72.80%
Operating Profit Margin (Excl OI)
9.57%
8.02%
1.55%
Values in Rs Cr.
Direction Arrows
Net Sales

Growth in half year ended Sep 2025 is 4.55% vs 28.95% in Sep 2024

Direction Arrows
Consolidated Net Profit

Growth in half year ended Sep 2025 is -72.80% vs -31.58% in Sep 2024

Nine Monthly Results Snapshot (Consolidated) - Dec'25stock-summary

Dec'25
Dec'24
Change(%)
Net Sales
2,770.78
2,589.59
7.00%
Operating Profit (PBDIT) excl Other Income
276.75
218.25
26.80%
Interest
74.27
85.27
-12.90%
Exceptional Items
-7.84
30.62
-125.60%
Consolidate Net Profit
68.33
76.27
-10.41%
Operating Profit Margin (Excl OI)
9.99%
8.43%
1.56%
Values in Rs Cr.
Direction Arrows
Net Sales

YoY Growth in nine months ended Dec 2025 is 7.00% vs 21.17% in Dec 2024

Direction Arrows
Consolidated Net Profit

YoY Growth in nine months ended Dec 2025 is -10.41% vs -35.27% in Dec 2024

Annual Results Snapshot (Consolidated) - Mar'26stock-summary

Mar'26
Mar'25
Change(%)
Net Sales
3,820.84
3,439.20
11.10%
Operating Profit (PBDIT) excl Other Income
393.37
244.98
60.57%
Interest
95.15
120.55
-21.07%
Exceptional Items
7.93
30.59
-74.08%
Consolidate Net Profit
159.61
89.35
78.63%
Operating Profit Margin (Excl OI)
10.30%
7.12%
3.18%
Values in Rs Cr.
Direction Arrows
Net Sales

YoY Growth in year ended Mar 2026 is 11.10% vs 15.32% in Mar 2025

Direction Arrows
Consolidated Net Profit

YoY Growth in year ended Mar 2026 is 78.63% vs -51.02% in Mar 2025

stock-summaryCompany CV
About Sheela Foam Ltd. stock-summary
stock-summary
Sheela Foam Ltd.
Small Cap
Furniture, Home Furnishing
Sheela Foam Ltd., a flagship company of Sheela Group is pioneered in the manufacturing of polyurethane foams in India and has ten manufacturing facilities, using the state of the art technology at strategic locations across the country. The Company is the pioneer in the mattress and foam industry with a wide range of offerings in home comfort, technical foam, and institutional foam range.
Company Coordinates stock-summary
Company Details
C-55 Preet Vihar , New Delhi Delhi : 110092
stock-summary
Tel: 91-11-22026875
stock-summary
iquebal.ahmed@sheelafoam.com
Registrar Details