
Compare Shelter Infra with Similar Stocks
Dashboard
With a Operating Losses, the company has a Weak Long Term Fundamental Strength
- Poor long term growth as Net Sales has grown by an annual rate of -5.55% and Operating profit at -29.03% over the last 5 years
- High Debt Company with a Debt to Equity ratio (avg) of 3.65 times
- The company has been able to generate a Return on Equity (avg) of 2.59% signifying low profitability per unit of shareholders funds
Flat results in Mar 26
Risky - Negative EBITDA
Stock DNA
Construction
INR 7 Cr (Micro Cap)
NA (Loss Making)
47
0.00%
2.48
-1.04%
1.77
Total Returns (Price + Dividend) 
Latest dividend: 0.5000 per share ex-dividend date: Aug-29-2011
Risk Adjusted Returns v/s
Returns Beta

News
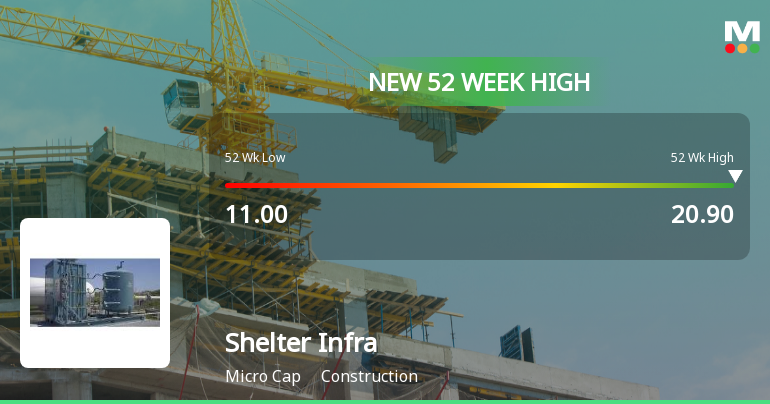
Shelter Infra Projects Ltd Hits New 52-Week High of Rs 20.9 on Back of Strong Technical Signals
A sustained rally has propelled Shelter Infra Projects Ltd to a fresh 52-week high of Rs 20.9 on 12 Jun 2026, marking a significant milestone after a 31.12% gain over the past year, comfortably outperforming the Sensex which declined by 8.75% in the same period.
Read full news article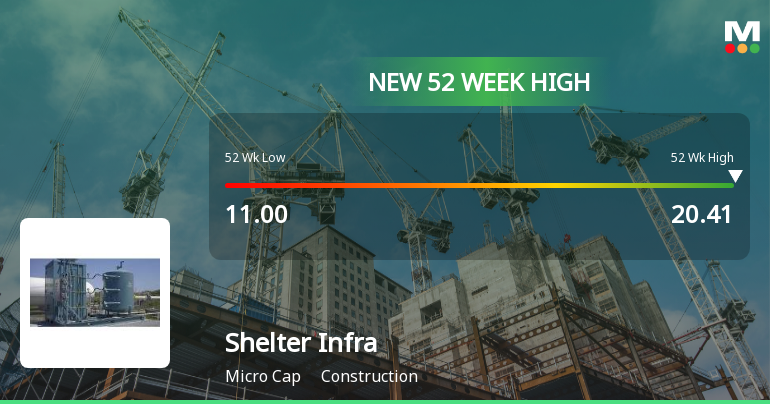
Shelter Infra Projects Ltd Hits New 52-Week High of Rs 20.41 on Back of Strong Technical Signals
From a 52-week low of Rs 11 to a fresh high of Rs 20.41, Shelter Infra Projects Ltd has surged 85.5% over the past year, significantly outperforming the Sensex, which declined 10.26% in the same period. This rally is underpinned by a broad alignment of technical indicators signalling sustained momentum.
Read full news article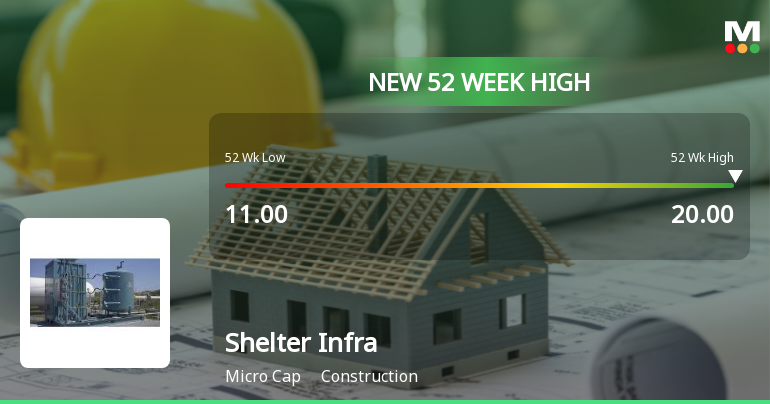
Broad-Based Technical Strength Lifts Shelter Infra Projects Ltd to 52-Week High of Rs 20
With a decisive break above Rs 20 on 8 Jun 2026, Shelter Infra Projects Ltd has reached a fresh 52-week high, marking a significant milestone in its price momentum. This surge comes amid a three-day winning streak that has propelled the stock up by 14.29%, outpacing its sector by nearly 6% today alone.
Read full news article Announcements
Announcement under Regulation 30 (LODR)-Newspaper Publication
28-May-2026 | Source : BSEPursuant to Regulation 30 and Regulation 47 of SEBI(LODR) Regulations 2015 we hereby submit copies of Newspaper Advertisement of Financial Results for Quarter ended 31.03.2026 in Business Standard and Arthik Lipi
Disclosure Of Related Party Transactions To Regulation 23(9) Of SEBI(LODR) Regulations 2015
27-May-2026 | Source : BSEPursuant to Regulation 23(9) of Listing Regulations we are enclosing disclosure of RPT for the half Yearly ended March 31 2026
Board Meeting Outcome for Outcome Of Board Meeting Held On Wednesday 27Th Day Of May2026
27-May-2026 | Source : BSEWe are enclosing Audited Financial Results for the Quarter ended 31st march 2026 which are approved in Board Meeting which was held today i.e Wednesday 27th Day of May 2026
Corporate Actions

No Upcoming Board Meetings

Shelter Infra Projects Ltd has declared 5% dividend, ex-date: 29 Aug 11

No Splits history available

No Bonus history available

No Rights history available
Quality key factors
Valuation key factors
Technicals key factors
 Technical Indicator Scale: Bearish, Mildly Bearish, Sideways, Mildly Bullish, Bullish Turned
 Shareholding Snapshot : Mar 2026
Shareholding Compare (%holding)
Promoters
None
Held by 0 Schemes
Held by 0 FIIs
None
Sekhar Podder (3.72%)
30.68%
Quarterly Results Snapshot (Standalone) - Mar'26 - QoQ

QoQ Growth in quarter ended Mar 2026 is 1.85% vs 1.89% in Dec 2025
QoQ Growth in quarter ended Mar 2026 is -33.33% vs 70.00% in Dec 2025
Half Yearly Results Snapshot (Standalone) - Sep'25
Growth in half year ended Sep 2025 is -5.04% vs 70.00% in Sep 2024
Growth in half year ended Sep 2025 is -88.89% vs 1,700.00% in Sep 2024
Nine Monthly Results Snapshot (Standalone) - Dec'25
YoY Growth in nine months ended Dec 2025 is -6.70% vs 70.48% in Dec 2024
YoY Growth in nine months ended Dec 2025 is -105.00% vs 1,100.00% in Dec 2024
Annual Results Snapshot (Standalone) - Mar'26
YoY Growth in year ended Mar 2026 is -7.14% vs 45.12% in Mar 2025
YoY Growth in year ended Mar 2026 is -121.74% vs 221.05% in Mar 2025
About Shelter Infra Projects Ltd

Company Coordinates


