
Compare Shera Energy with Similar Stocks
Dashboard
High Management Efficiency with a high ROCE of 22.08%
Healthy long term growth as Net Sales has grown by an annual rate of 39.32%
The company has declared Positive results for the last 4 consecutive quarters
With ROCE of 16.7, it has a Attractive valuation with a 1.4 Enterprise value to Capital Employed
Below par performance in long term as well as near term
Stock DNA
Non - Ferrous Metals
INR 379 Cr (Micro Cap)
15.00
14
0.00%
1.23
12.98%
1.92
Total Returns (Price + Dividend) 
Shera Energy for the last several years.
Risk Adjusted Returns v/s
Returns Beta

News
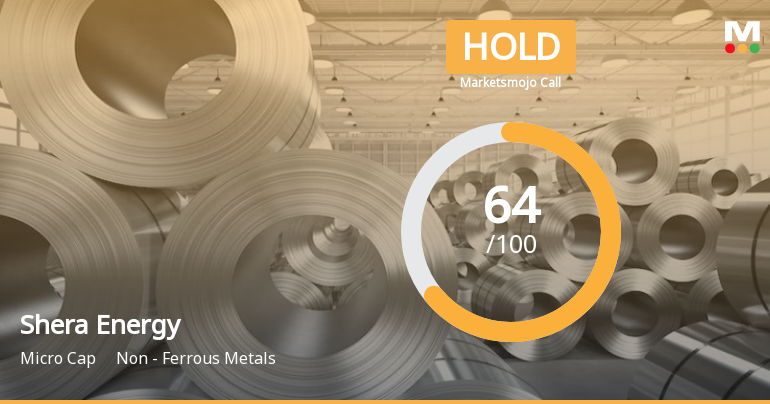
Shera Energy Ltd is Rated Hold by MarketsMOJO
Shera Energy Ltd is rated 'Hold' by MarketsMOJO, with this rating last updated on 01 June 2026. However, the analysis and financial metrics discussed below reflect the company’s current position as of 10 June 2026, providing investors with the most up-to-date insight into the stock’s performance and outlook.
Read full news article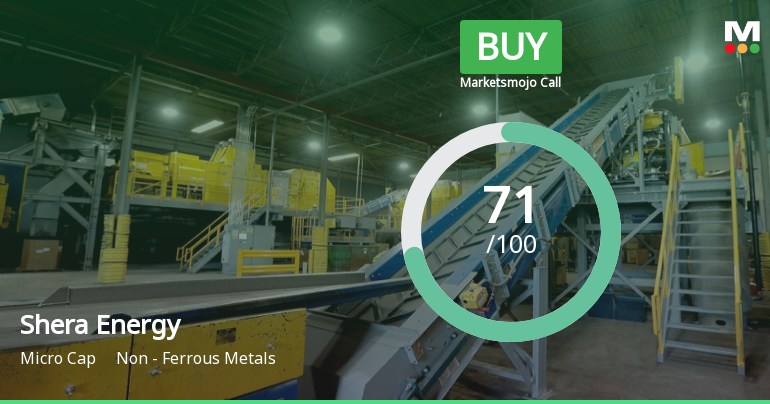
Shera Energy Ltd is Rated Buy
Shera Energy Ltd is rated 'Buy' by MarketsMOJO, with this rating last updated on 19 May 2026. However, the analysis and financial metrics discussed here reflect the stock's current position as of 27 May 2026, providing investors with the most up-to-date insight into the company’s performance and outlook.
Read full news article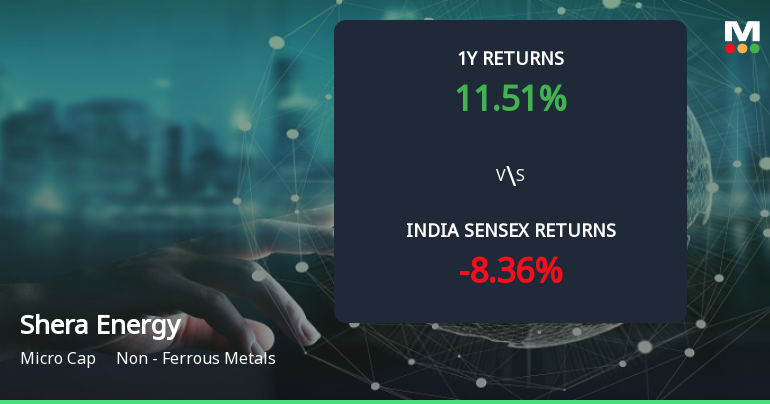
Shera Energy Ltd Forms Golden Cross Amid Mixed Technical Signals and Recent Price Dip
The 50-day moving average has crossed above the 200-day moving average for Shera Energy Ltd, signalling a golden cross on 19 Jun 2026. Yet, the stock declined 2.59% on the day the cross formed, while monthly technical indicators remain mildly bearish. This divergence between the moving averages and other signals calls for a detailed examination of the cross's reliability.
Read full news article Announcements
Corporate Actions

No Upcoming Board Meetings

No Dividend history available

No Splits history available

No Bonus history available

No Rights history available
Quality key factors
Valuation key factors
Technicals key factors
 Technical Indicator Scale: Bearish, Mildly Bearish, Sideways, Mildly Bullish, Bullish Turned
 Shareholding Snapshot : Mar 2026
Shareholding Compare (%holding)
Promoters
None
Held by 0 Schemes
Held by 0 FIIs
Sheikh Naseem (31.46%)
Momentum Biotech Private Limited (1.46%)
25.69%
Quarterly Results Snapshot (Consolidated) - Dec'25 - QoQ

QoQ Growth in quarter ended Dec 2025 is 0.68% vs 1.85% in Sep 2025
QoQ Growth in quarter ended Dec 2025 is 14.92% vs 20.55% in Sep 2025
Half Yearly Results Snapshot (Consolidated) - Mar'26
Growth in half year ended Mar 2026 is 10.09% vs 15.49% in Sep 2025

Growth in half year ended Mar 2026 is 44.59% vs 17.38% in Sep 2025
Nine Monthly Results Snapshot (Consolidated) - Dec'25
YoY Growth in nine months ended Dec 2025 is 29.84% vs 53.69% in Dec 2024
YoY Growth in nine months ended Dec 2025 is 60.15% vs 28.09% in Dec 2024
Annual Results Snapshot (Consolidated) - Mar'26
YoY Growth in year ended Mar 2026 is 28.40% vs 45.96% in Mar 2025
YoY Growth in year ended Mar 2026 is 65.17% vs 49.83% in Mar 2025
About Shera Energy Ltd

Company Coordinates


