
Compare Shervani Indl Sy with Similar Stocks
Dashboard
With a Operating Losses, the company has a Weak Long Term Fundamental Strength
- The company has been able to generate a Return on Equity (avg) of 7.80% signifying low profitability per unit of shareholders funds
With a fall in Operating Profit of -50.16%, the company declared Very Negative results in Mar 26
Risky - Negative EBITDA
Below par performance in long term as well as near term
Stock DNA
Realty
INR 73 Cr (Micro Cap)
NA (Loss Making)
35
1.05%
0.03
-0.55%
0.55
Total Returns (Price + Dividend) 
Latest dividend: 3.063546798029557 per share ex-dividend date: Sep-23-2025
Risk Adjusted Returns v/s
Returns Beta

News

Shervani Industrial Syndicate Ltd is Rated Strong Sell
Shervani Industrial Syndicate Ltd is rated Strong Sell by MarketsMOJO, with this rating last updated on 13 Nov 2025. However, the analysis and financial metrics discussed here reflect the stock’s current position as of 17 June 2026, providing investors with the latest insights into the company’s performance and outlook.
Read full news article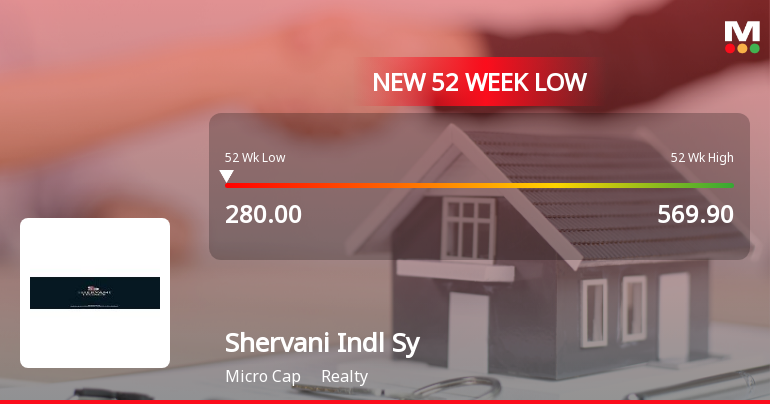
Markets Rally, But Shervani Industrial Syndicate Ltd Sinks to 52-Week Low in Stock-Specific Sell-Off
Despite a broadly positive market environment, Shervani Industrial Syndicate Ltd has plunged to a fresh 52-week low of Rs 280 on 16 Jun 2026, marking a continuation of its downward trajectory amid persistent financial headwinds.
Read full news article
Shervani Industrial Syndicate Ltd is Rated Strong Sell
Shervani Industrial Syndicate Ltd is rated Strong Sell by MarketsMOJO, with this rating last updated on 13 Nov 2025. However, the analysis and financial metrics presented here reflect the company’s current position as of 08 June 2026, providing investors with an up-to-date view of its fundamentals, returns, and overall outlook.
Read full news article Announcements
Corrigendum Regarding The Audited Financial Result For The Quarter & Year Ended 31.03.2026
10-Jun-2026 | Source : BSEIn continuation to our audited financial result for the quarter & year ended 31.03.2026 We herewith attached detailed corrigendum with respect to revised and corrected figures of Borrowings (Current & Non Current). which were inadvertently stated incorrectly earlier and was purely typographical error.
Corporate Action-Board to consider Dividend
18-May-2026 | Source : BSEBoard has recommended the dividend @ 25 for the financial year 2025-26 subject to approval of Shareholder(s) at the ensuing AGM.
Audited Result For The Quarter And Year Ended March 31 2026
18-May-2026 | Source : BSEWe hereby attaching the Audited Financial Result along with Audit Report issued by Statutory Auditor of the Company
Corporate Actions

No Upcoming Board Meetings

Shervani Industrial Syndicate Ltd has declared 30% dividend, ex-date: 23 Sep 25

No Splits history available

No Bonus history available

No Rights history available
Quality key factors
Valuation key factors
Technicals key factors
 Technical Indicator Scale: Bearish, Mildly Bearish, Sideways, Mildly Bullish, Bullish Turned
 Shareholding Snapshot : Mar 2026
Shareholding Compare (%holding)
Promoters
None
Held by 0 Schemes
Held by 0 FIIs
Saleem Iqbal Shervani (38.6%)
Frost Traders Private Limited (14.29%)
16.44%
Quarterly Results Snapshot (Consolidated) - Mar'26 - YoY

YoY Growth in quarter ended Mar 2026 is -76.79% vs -75.00% in Mar 2025
YoY Growth in quarter ended Mar 2026 is -141.29% vs 176.43% in Mar 2025
Half Yearly Results Snapshot (Consolidated) - Sep'25

Growth in half year ended Sep 2025 is -59.70% vs -70.88% in Sep 2024
Growth in half year ended Sep 2025 is -94.70% vs -95.36% in Sep 2024
Nine Monthly Results Snapshot (Consolidated) - Dec'25
YoY Growth in nine months ended Dec 2025 is -55.19% vs -64.13% in Dec 2024
YoY Growth in nine months ended Dec 2025 is -94.57% vs -94.50% in Dec 2024
Annual Results Snapshot (Consolidated) - Mar'26
YoY Growth in year ended Mar 2026 is -55.85% vs -66.08% in Mar 2025
YoY Growth in year ended Mar 2026 is -118.96% vs -87.52% in Mar 2025
About Shervani Industrial Syndicate Ltd

Company Coordinates


