
Compare Shibaura Mechatronics Corp. with Similar Stocks
Dashboard
Strong Long Term Fundamental Strength with an average Return on Equity (ROE) of 19.75%
- Healthy long term growth as Operating profit has grown by an annual rate 35.26%
- Company has very low debt and has enough cash to service the debt requirements
With ROE of 21.83%, it has a very attractive valuation with a 2.37 Price to Book Value
Market Beating performance in long term as well as near term
Stock DNA
Industrial Manufacturing
JPY 143,911 Million (Small Cap)
11.00
NA
0.00%
-0.29
23.58%
3.11
Total Returns (Price + Dividend) 
Shibaura Mechatronics Corp. for the last several years.
Risk Adjusted Returns v/s
News

Shibaura Mechatronics Hits Day Low of JPY 15,630 Amid Price Pressure
Shibaura Mechatronics Corp. saw a significant decline in stock price today, contrasting with the broader market's performance. However, the company has shown strong long-term growth, with a notable increase over the past year and solid financial metrics, including a robust return on equity and low debt levels.
Read full news article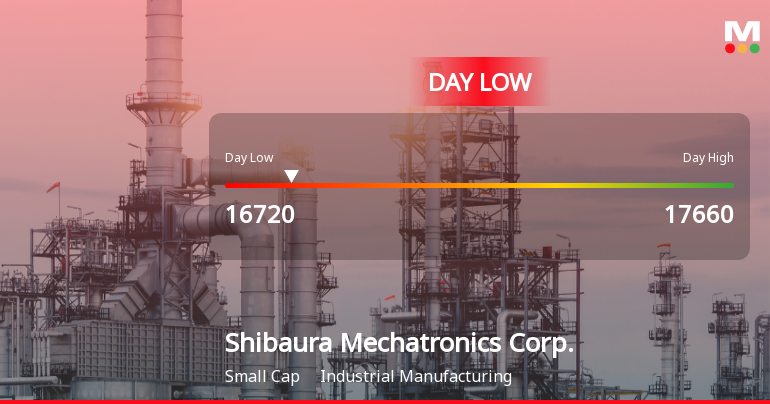
Shibaura Mechatronics Hits Day Low at JPY 16,720 Amid Price Pressure
Shibaura Mechatronics Corp. saw a significant stock decline on October 22, 2025, reaching an intraday low. Despite this, the company has shown strong performance over various periods, with notable gains in the past month and year, and maintains a solid financial foundation and growth potential in the industrial manufacturing sector.
Read full news article Announcements

Corporate Actions
Quality key factors
Valuation key factors
Technicals key factors
 Technical Indicator Scale: Bearish, Mildly Bearish, Sideways, Mildly Bullish, Bullish Turned
 Shareholding Snapshot
Shareholding Compare (%holding)
Quarterly Results Snapshot (Consolidated) - Jun'25 - QoQ

QoQ Growth in quarter ended Jun 2025 is -11.69% vs 20.82% in Mar 2025
QoQ Growth in quarter ended Jun 2025 is -14.97% vs 18.64% in Mar 2025
Annual Results Snapshot (Consolidated) - Mar'25

YoY Growth in year ended Mar 2025 is 19.77% vs 10.75% in Mar 2024
YoY Growth in year ended Mar 2025 is 17.46% vs -4.40% in Mar 2024
About Shibaura Mechatronics Corp.

Company Coordinates


