
Compare Shinobu Foods Products Co., Ltd. with Similar Stocks
Dashboard
1
High Management Efficiency with a high ROCE of 11.55%
2
Company's ability to service its debt is strong with a healthy EBIT to Interest (avg) ratio of 46.03
3
Poor long term growth as Net Sales has grown by an annual rate of 1.89% over the last 5 years
4
Flat results in Jun 25
5
With ROCE of 15.90%, it has a very attractive valuation with a 1.03 Enterprise value to Capital Employed
6
Market Beating performance in long term as well as near term
Total Returns (Price + Dividend) 
TimePeriod
Price Return
Dividend Return
Total Return
3 Months
92.54%
0%
92.54%
6 Months
109.64%
0%
109.64%
1 Year
111.01%
0%
111.01%
2 Years
147.76%
0%
147.76%
3 Years
211.59%
0%
211.59%
4 Years
210.1%
0%
210.1%
5 Years
218.78%
0%
218.78%
Shinobu Foods Products Co., Ltd. for the last several years.
Risk Adjusted Returns v/s
News
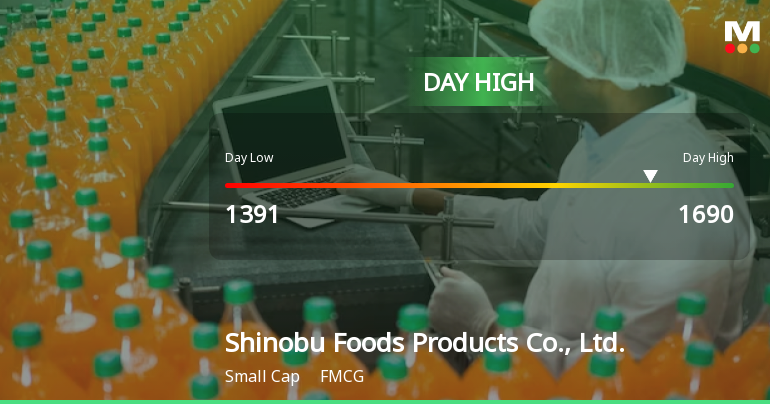
Shinobu Foods Hits Day High with 15.09% Surge in Stock Price
Shinobu Foods Products Co. has seen a notable increase in its stock price, achieving an intraday high while the Japan Nikkei 225 declined. Over the past year, the company has outperformed the index significantly, supported by strong financial metrics and a solid balance sheet, indicating its competitive position in the FMCG sector.
Read full news article Announcements

No announcement available
Corporate Actions
No corporate action available
Quality key factors
Factor
Value
Sales Growth (5y)
1.89%
EBIT Growth (5y)
13.11%
EBIT to Interest (avg)
46.03
Debt to EBITDA (avg)
0.74
Net Debt to Equity (avg)
-0.03
Sales to Capital Employed (avg)
2.54
Tax Ratio
26.74%
Dividend Payout Ratio
32.92%
Pledged Shares
0
Institutional Holding
0
ROCE (avg)
11.55%
ROE (avg)
10.07%
Valuation key factors
Factor
Value
P/E Ratio
8
Industry P/E
Price to Book Value
1.03
EV to EBIT
6.50
EV to EBITDA
3.88
EV to Capital Employed
1.03
EV to Sales
0.26
PEG Ratio
NA
Dividend Yield
NA
ROCE (Latest)
15.90%
ROE (Latest)
12.80%
Technicals key factors
Indicator
Weekly
Monthly
MACD
Bullish
Bullish
RSI
No Signal
No Signal
Bollinger Bands
Mildly Bullish
Mildly Bullish
Moving Averages
Bullish (Daily)
KST
Bullish
Bullish
Dow Theory
Mildly Bullish
Mildly Bullish
OBV
Mildly Bullish
Mildly Bullish
 Technical Indicator Scale: Bearish, Mildly Bearish, Sideways, Mildly Bullish, Bullish Turned
 Shareholding Snapshot
No data for shareholding present.
Shareholding Compare (%holding)
No data for shareholding present.
Quarterly Results Snapshot (Consolidated) - Sep'25 - QoQ
Sep'25
Jun'25
Change(%)
Net Sales
15,899.00
15,336.00
3.67%
Operating Profit (PBDIT) excl Other Income
1,081.00
1,054.00
2.56%
Interest
9.00
8.00
12.50%
Exceptional Items
0.00
0.00
Consolidate Net Profit
554.00
492.00
12.60%
Operating Profit Margin (Excl OI)
43.80%
45.80%
-0.20%
USD in Million.

Net Sales
QoQ Growth in quarter ended Sep 2025 is 3.67% vs 7.88% in Jun 2025
Consolidated Net Profit
QoQ Growth in quarter ended Sep 2025 is 12.60% vs 209.33% in Jun 2025
Annual Results Snapshot (Consolidated) - Mar'25
Mar'25
Mar'24
Change(%)
Net Sales
57,651.00
54,825.00
5.15%
Operating Profit (PBDIT) excl Other Income
3,901.00
3,909.00
-0.20%
Interest
35.00
39.00
-10.26%
Exceptional Items
-937.00
-762.00
-22.97%
Consolidate Net Profit
999.00
1,169.00
-14.54%
Operating Profit Margin (Excl OI)
40.50%
43.20%
-0.27%
USD in Million.
Net Sales
YoY Growth in year ended Mar 2025 is 5.15% vs 7.40% in Mar 2024
Consolidated Net Profit
YoY Growth in year ended Mar 2025 is -14.54% vs 1,034.95% in Mar 2024
About Shinobu Foods Products Co., Ltd.

Shinobu Foods Products Co., Ltd.
FMCG
No Details Available.
Company Coordinates
No Company Details Available
InfinHub Market Technologies FZ-LLC, Building-2, Unit 112, Dubai Internet City, Dubai, United Arab Emirates
GET THE MARKETSMOJO APP


Company
Stocks
Portfolio


"Investment in securities markets are subject to market risk. Read all the related documents carefully before investing."