
Compare Shish Industries with Similar Stocks
Stock DNA
Plastic Products - Industrial
INR 486 Cr (Micro Cap)
64.00
35
0.00%
0.22
4.05%
2.60
Total Returns (Price + Dividend) 
Shish Industries for the last several years.
Risk Adjusted Returns v/s
Returns Beta

News

Shish Industries Ltd is Rated Sell by MarketsMOJO
Shish Industries Ltd is rated 'Sell' by MarketsMOJO, with this rating last updated on 01 June 2026. However, the analysis and financial metrics discussed here reflect the stock's current position as of 10 June 2026, providing investors with an up-to-date view of the company’s fundamentals, valuation, financial trends, and technical outlook.
Read full news article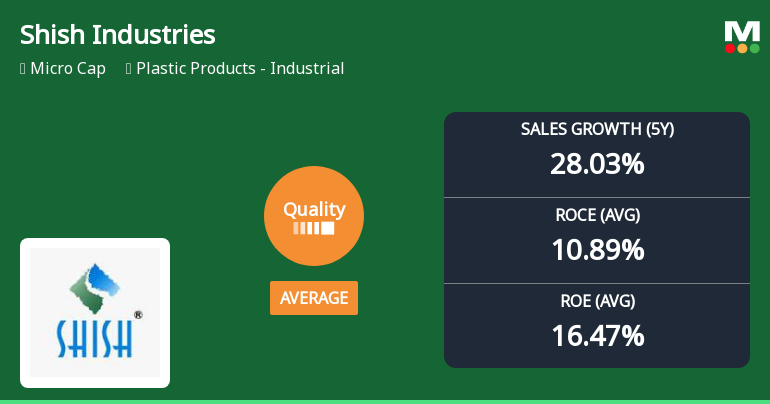
Shish Industries Ltd Downgraded to Average Quality Amid Mixed Financial Signals
Shish Industries Ltd, a micro-cap player in the Plastic Products - Industrial sector, has seen its quality rating downgraded from good to average as of 1 June 2026. Despite a strong historical growth trajectory, recent assessments reveal a mixed bag of financial fundamentals, with improvements in some areas offset by deteriorations in others. This article analyses the key changes in the company’s business quality parameters, including return ratios, debt levels, and consistency metrics, to provide a comprehensive view of its current standing.
Read full news articleAre Shish Industries Ltd latest results good or bad?
Shish Industries Ltd's latest financial results for the quarter ended March 2026 reveal a complex operational landscape. The company achieved record net sales of ₹38.15 crores, reflecting a year-on-year growth of 7.43%. However, this topline growth was overshadowed by significant challenges in profitability. The operating margin, excluding other income, plunged to -0.26%, a stark decline from the previous quarter's 12.71%. This indicates that the company's core operations are currently loss-making, raising concerns about its operational sustainability. The consolidated net profit for the quarter was reported at ₹1.76 crores, which represents a 26.05% decline compared to the same period last year, despite a notable sequential increase of 67.62% from the previous quarter. This highlights a troubling reliance on other income, which accounted for an extraordinary 7,966.67% of profit before tax, further questio...
Read full news article Announcements
Compliances-Reg.24(A)-Annual Secretarial Compliance
30-May-2026 | Source : BSEANnual secretarial compliance report for the year ended 31/03/2026 is submitted hereby.
Financial Results For The Quarter And Year Ended 31/03/2026
29-May-2026 | Source : BSEThe financial results for the quarter and year ended 31/03/2026 are submitted hereby.
Board Meeting Intimation for Board Meeting Scheduled On 29/05/2026 For Approval Of Audited Standalone And Consolidated Financial Results For Quarter And Year Ended 31/03/2026
21-May-2026 | Source : BSEShish Industries Ltdhas informed BSE that the meeting of the Board of Directors of the Company is scheduled on 29/05/2026 inter alia to consider and approve audited standalone and consolidated financial results for quarter and year ended 31/03/2026
Corporate Actions

No Upcoming Board Meetings

No Dividend history available

Shish Industries Ltd has announced 1:10 stock split, ex-date: 17 Dec 24

Shish Industries Ltd has announced 2:1 bonus issue, ex-date: 28 Jul 23

No Rights history available
Quality key factors
Valuation key factors
Technicals key factors
 Technical Indicator Scale: Bearish, Mildly Bearish, Sideways, Mildly Bullish, Bullish Turned
 Shareholding Snapshot : Mar 2026
Shareholding Compare (%holding)
Promoters
None
Held by 0 Schemes
Held by 0 FIIs
Rameshbhai Virjibhai Kakadiya (27.05%)
Sunilkumar Diplal Shah . (2.24%)
42.66%
Quarterly Results Snapshot (Consolidated) - Mar'26 - YoY

YoY Growth in quarter ended Mar 2026 is 7.43% vs 52.21% in Mar 2025
YoY Growth in quarter ended Mar 2026 is -26.05% vs -22.22% in Mar 2025
Half Yearly Results Snapshot (Consolidated) - Sep'25

Growth in half year ended Sep 2025 is 37.58% vs 20.07% in Sep 2024
Growth in half year ended Sep 2025 is 5.38% vs 30.79% in Sep 2024
Nine Monthly Results Snapshot (Consolidated) - Dec'25
YoY Growth in nine months ended Dec 2025 is 19.20% vs 29.39% in Dec 2024
YoY Growth in nine months ended Dec 2025 is -9.59% vs 28.74% in Dec 2024
Annual Results Snapshot (Consolidated) - Mar'26
YoY Growth in year ended Mar 2026 is 15.60% vs 35.58% in Mar 2025
YoY Growth in year ended Mar 2026 is -16.82% vs 9.25% in Mar 2025
About Shish Industries Ltd

Company Coordinates


