
Compare Shiva Global with Similar Stocks
Dashboard
Weak Long Term Fundamental Strength with a -23.62% CAGR growth in Operating Profits over the last 5 years
- Low ability to service debt as the company has a high Debt to EBITDA ratio of 3.37 times
- The company has been able to generate a Return on Equity (avg) of 3.98% signifying low profitability per unit of shareholders funds
Flat results in Mar 26
With ROCE of 4.6, it has a Very Attractive valuation with a 0.6 Enterprise value to Capital Employed
Majority shareholders : Promoters
Stock DNA
Fertilizers
INR 40 Cr (Micro Cap)
NA (Loss Making)
23
0.00%
0.24
-0.02%
0.46
Total Returns (Price + Dividend) 
Latest dividend: 0.7 per share ex-dividend date: Sep-20-2022
Risk Adjusted Returns v/s
Returns Beta

News
Shiva Global Agro Industries Ltd Upgraded to Hold on Technical and Valuation Improvements
Shiva Global Agro Industries Ltd has seen its investment rating upgraded from Sell to Hold, reflecting a notable improvement in its technical outlook and valuation metrics despite ongoing challenges in its financial trend and quality parameters. The micro-cap fertilizer company’s Mojo Score has risen to 54.0, signalling a cautious but more optimistic stance among investors as of 16 July 2026.
Read full news article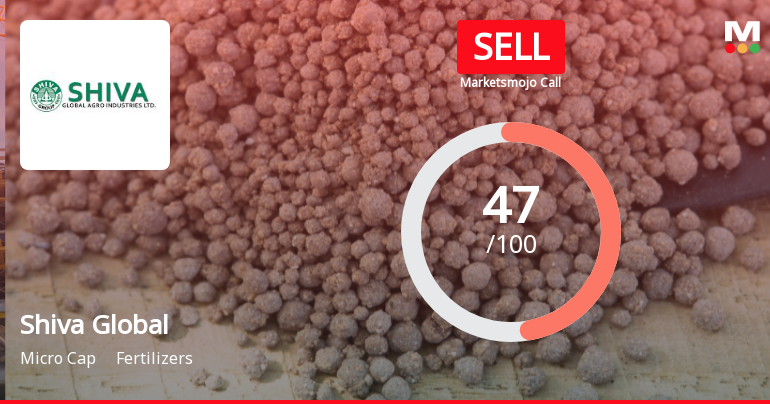
Shiva Global Agro Industries Downgraded to Sell Amid Mixed Fundamentals and Technical Signals
Shiva Global Agro Industries Ltd, a micro-cap player in the fertilisers sector, has seen its investment rating downgraded from Hold to Sell as of 6 July 2026. This change reflects a combination of deteriorating technical indicators, subdued financial trends, and weak fundamental quality despite attractive valuation metrics. The company’s current Mojo Score stands at 47.0, signalling caution for investors amid a challenging operating environment.
Read full news article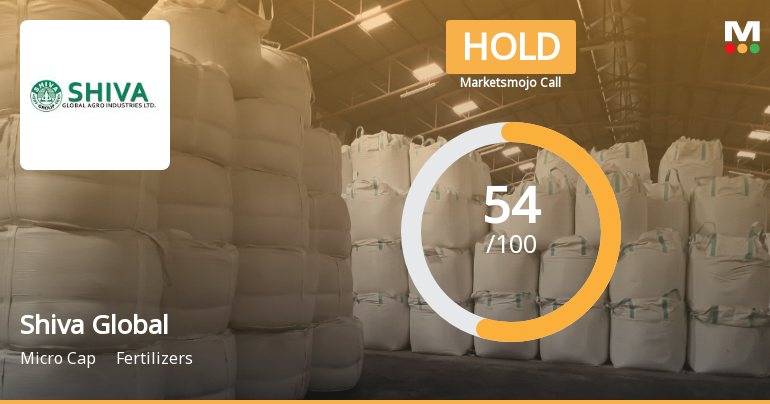
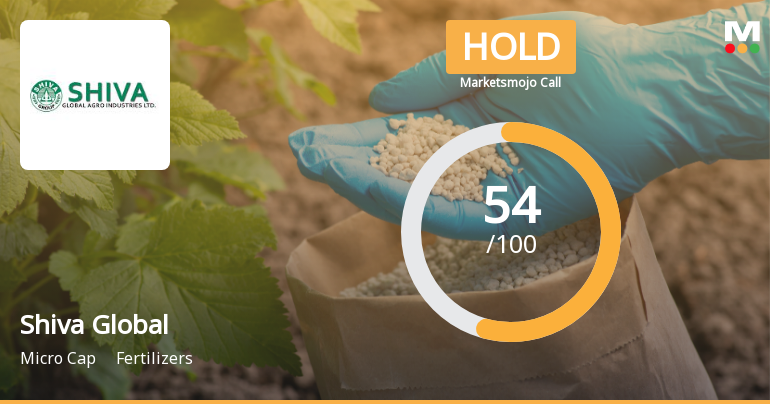
Shiva Global Agro Industries Ltd Upgraded to Hold on Technical Improvement and Valuation Appeal
Shiva Global Agro Industries Ltd has seen its investment rating upgraded from Sell to Hold, driven primarily by a marked improvement in technical indicators and an attractive valuation profile despite flat recent financial performance. The micro-cap fertilizer company’s Mojo Score rose to 54.0, reflecting a more balanced outlook amid mixed fundamental signals.
Read full news article Announcements
Closure of Trading Window
27-Jun-2026 | Source : BSEPursuant to the SEBI (Prohibition of Insider Trading) Regulations 2015 and the Code of Conduct to regulate monitor and report trading by Insiders of the Company adopted by the Board of Directors the Trading Window for dealing in securities of the Company will remain closed for all the Designated Persons/connected persons and their relatives during the period starting from July 01 2026 till 48 hours after declaration of audited financial results of the Company for the quarter ending June 30 2026. We kindly request you to take the above submission on record.
Closure of Trading Window
27-Jun-2026 | Source : BSEPursuant to the SEBI (Prohibition of Insider Trading) Regulations 2015 and the Code of Conduct to regulate monitor and report trading by Insiders of the Company adopted by the Board of Directors the Trading Window for dealing in securities of the Company will remain closed for all the Designated Persons/connected persons and their relatives during the period starting from July 01 2026 till 48 hours after declaration of unaudited financial results of the Company for the quarter ending June 30 2026. We kindly request you to take the above submission on record.
Board Meeting Outcome for Intimation Under Regulation 30 And Regulation 33 Of The SEBI (Listing Obligations And Disclosure Requirements) Regulation 2015 - Outcome Of Board Meeting Held On May 30 2026
30-May-2026 | Source : BSEOutcome of Board Meeting held on May 30 2026 - Audited Standalone and Consolidated Financial Results of the Company for the quarter and year ended March 31 2026
Corporate Actions

No Upcoming Board Meetings

Shiva Global Agro Industries Ltd has declared 7% dividend, ex-date: 20 Sep 22

No Splits history available

No Bonus history available

No Rights history available
Quality key factors
Valuation key factors
Technicals key factors
 Technical Indicator Scale: Bearish, Mildly Bearish, Sideways, Mildly Bullish, Bullish Turned
 Shareholding Snapshot : Mar 2026
Shareholding Compare (%holding)
Promoters
None
Held by 0 Schemes
Held by 0 FIIs
Omprakash Kannaiyalal Gilda (11.91%)
Lokyabai Sambhaji Pawar (3.28%)
38.41%
Quarterly Results Snapshot (Consolidated) - Mar'26 - QoQ

QoQ Growth in quarter ended Mar 2026 is -16.32% vs 77.50% in Dec 2025

QoQ Growth in quarter ended Mar 2026 is 180.26% vs -14.57% in Dec 2025
Half Yearly Results Snapshot (Consolidated) - Sep'25
Growth in half year ended Sep 2025 is -33.58% vs 7.22% in Sep 2024
Growth in half year ended Sep 2025 is 107.05% vs -44.11% in Sep 2024
Nine Monthly Results Snapshot (Consolidated) - Dec'25
YoY Growth in nine months ended Dec 2025 is -27.81% vs 4.80% in Dec 2024
YoY Growth in nine months ended Dec 2025 is -249.59% vs 106.71% in Dec 2024
Annual Results Snapshot (Consolidated) - Mar'26
YoY Growth in year ended Mar 2026 is -27.55% vs 4.30% in Mar 2025
YoY Growth in year ended Mar 2026 is -100.30% vs 118.61% in Mar 2025
About Shiva Global Agro Industries Ltd

Company Coordinates


