
Compare Shiva Global with Similar Stocks
Dashboard
Weak Long Term Fundamental Strength with a -23.62% CAGR growth in Operating Profits over the last 5 years
- Low ability to service debt as the company has a high Debt to EBITDA ratio of 3.37 times
- The company has been able to generate a Return on Equity (avg) of 3.98% signifying low profitability per unit of shareholders funds
Flat results in Mar 26
Stock DNA
Fertilizers
INR 43 Cr (Micro Cap)
NA (Loss Making)
22
0.00%
0.24
-0.02%
0.47
Total Returns (Price + Dividend) 
Latest dividend: 0.7 per share ex-dividend date: Sep-20-2022
Risk Adjusted Returns v/s
Returns Beta

News
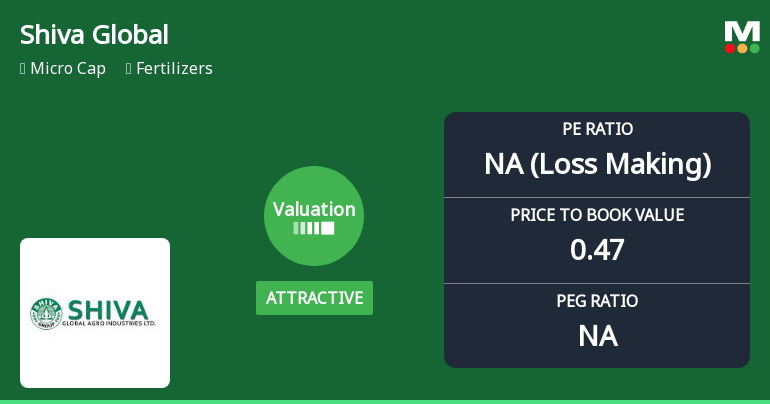
Shiva Global Agro Industries Ltd: Valuation Shift Signals Renewed Price Attractiveness
Shiva Global Agro Industries Ltd has witnessed a notable shift in its valuation parameters, moving from a very attractive to an attractive rating, reflecting a subtle but meaningful improvement in price attractiveness. Despite lingering challenges in profitability, the stock’s valuation metrics relative to peers and historical benchmarks suggest a cautiously optimistic outlook for investors seeking exposure in the fertilizers sector.
Read full news articleAre Shiva Global Agro Industries Ltd latest results good or bad?
Shiva Global Agro Industries Ltd's latest financial results for Q4 FY26 reflect a complex operational landscape. The company reported a consolidated net profit of ₹1.83 crores, which marks a year-on-year decline of 11.17%. In terms of net sales, the figure stood at ₹68.80 crores, down 26.78% compared to the same quarter last year, indicating ongoing challenges in revenue generation. This decline in sales represents the third consecutive quarter of year-on-year revenue contraction, highlighting persistent demand-side issues within the agricultural sector. Despite these challenges, there was a notable sequential recovery in operating profit, with an operating margin of 5.70%, significantly higher than the near-zero margin of 0.24% in the previous quarter. This improvement suggests some operational stabilization, although it remains below the margins achieved earlier in the fiscal year. The company’s return o...
Read full news article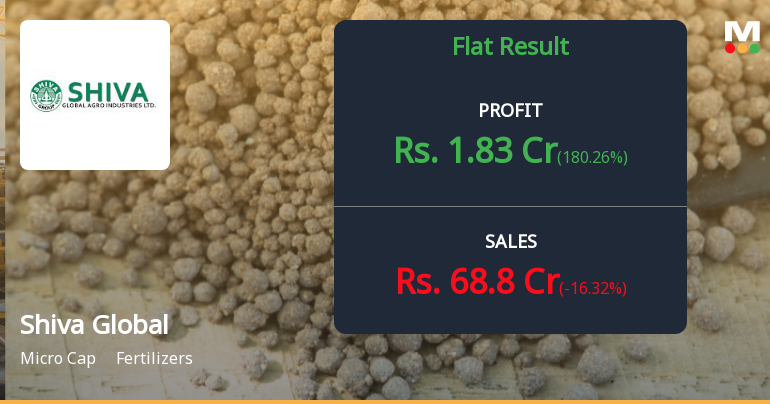
Shiva Global Agro Q4 FY26: Return to Profitability Masks Persistent Operational Challenges
Shiva Global Agro Industries Ltd., a micro-cap fertiliser manufacturer with a market capitalisation of ₹41.00 crores, posted a consolidated net profit of ₹1.83 crores in Q4 FY26, a sharp reversal from the ₹2.28 crores loss in the previous quarter. However, the quarter-on-quarter improvement of 180.26% masks a troubling year-on-year decline of 11.17%, highlighting the company's struggle to sustain profitability amidst sector headwinds. The stock surged 5.32% to ₹41.00 following the results, yet remains 22.13% below its 52-week high of ₹52.65.
Read full news article Announcements
Board Meeting Outcome for Intimation Under Regulation 30 And Regulation 33 Of The SEBI (Listing Obligations And Disclosure Requirements) Regulation 2015 - Outcome Of Board Meeting Held On May 30 2026
30-May-2026 | Source : BSEOutcome of Board Meeting held on May 30 2026 - Audited Standalone and Consolidated Financial Results of the Company for the quarter and year ended March 31 2026
Intimation Under Regulation 30 And Regulation 33 Of The SEBI (Listing Obligations And Disclosure Requirements) Regulation 2015 - Outcome Of Board Meeting Held On May 30 2026
30-May-2026 | Source : BSEAudited Standalone and Consolidated Financial Results of the Company for the quarter and year ended March 31 2026
Board Meeting Intimation for Recording Of Audited Financial Results For The Quarter And Year Ended March 31 2026.
18-May-2026 | Source : BSEShiva Global Agro Industries Ltdhas informed BSE that the meeting of the Board of Directors of the Company is scheduled on 30/05/2026 inter alia to consider and approve Audited Financial Results for the quarter and year ended March 31 2026.
Corporate Actions

No Upcoming Board Meetings

Shiva Global Agro Industries Ltd has declared 7% dividend, ex-date: 20 Sep 22

No Splits history available

No Bonus history available

No Rights history available
Quality key factors
Valuation key factors
Technicals key factors
 Technical Indicator Scale: Bearish, Mildly Bearish, Sideways, Mildly Bullish, Bullish Turned
 Shareholding Snapshot : Mar 2026
Shareholding Compare (%holding)
Promoters
None
Held by 0 Schemes
Held by 0 FIIs
Omprakash Kannaiyalal Gilda (11.91%)
Lokyabai Sambhaji Pawar (3.28%)
38.41%
Quarterly Results Snapshot (Consolidated) - Mar'26 - QoQ

QoQ Growth in quarter ended Mar 2026 is -16.32% vs 77.50% in Dec 2025

QoQ Growth in quarter ended Mar 2026 is 180.26% vs -14.57% in Dec 2025
Half Yearly Results Snapshot (Consolidated) - Sep'25
Growth in half year ended Sep 2025 is -33.58% vs 7.22% in Sep 2024
Growth in half year ended Sep 2025 is 107.05% vs -44.11% in Sep 2024
Nine Monthly Results Snapshot (Consolidated) - Dec'25
YoY Growth in nine months ended Dec 2025 is -27.81% vs 4.80% in Dec 2024
YoY Growth in nine months ended Dec 2025 is -249.59% vs 106.71% in Dec 2024
Annual Results Snapshot (Consolidated) - Mar'26
YoY Growth in year ended Mar 2026 is -27.55% vs 4.30% in Mar 2025
YoY Growth in year ended Mar 2026 is -100.30% vs 118.61% in Mar 2025
About Shiva Global Agro Industries Ltd

Company Coordinates


