
Compare Shivagrico Impl. with Similar Stocks
Dashboard
Weak Long Term Fundamental Strength with an average Return on Capital Employed (ROCE) of 6.38%
- Poor long term growth as Net Sales has grown by an annual rate of 4.43% and Operating profit at 10.04% over the last 5 years
- Low ability to service debt as the company has a high Debt to EBITDA ratio of 5.36 times
Flat results in Mar 26
Stock DNA
Industrial Manufacturing
INR 13 Cr (Micro Cap)
34.00
35
0.00%
2.11
4.70%
1.59
Total Returns (Price + Dividend) 
Shivagrico Impl. for the last several years.
Risk Adjusted Returns v/s
Returns Beta

News
Are Shivagrico Implements Ltd latest results good or bad?
Shivagrico Implements Ltd's latest financial results for Q4 FY26 present a complex picture of the company's operational performance. The company reported net sales of ₹11.98 crores, reflecting a sequential decline of 3.39% from ₹12.40 crores in the previous quarter, as well as a year-on-year contraction of 2.36% from ₹12.27 crores in Q4 FY25. This stagnation in revenue generation raises concerns about the company's ability to grow amidst a recovering industrial landscape. On the profitability front, net profit for the quarter was ₹0.14 crores, which represents a sequential improvement of 27.27% from ₹0.11 crores in Q3 FY26. However, this figure is significantly lower compared to the ₹0.23 crores reported in Q4 FY25, indicating a year-on-year decline of 39.13%. The operating margin showed a positive trend, expanding to 8.01% from 6.13% in the previous quarter, driven by better cost management despite the re...
Read full news article
Shivagrico Implements Ltd Downgraded to Strong Sell Amid Valuation and Financial Concerns
Shivagrico Implements Ltd, a micro-cap player in the industrial manufacturing sector, has seen its investment rating upgraded from Sell to Strong Sell as of 2 June 2026. This change is primarily driven by an improvement in valuation metrics, even as the company continues to grapple with weak financial trends and high leverage. The nuanced shift reflects a complex interplay of quality, valuation, financial performance, and technical factors that investors should carefully consider.
Read full news article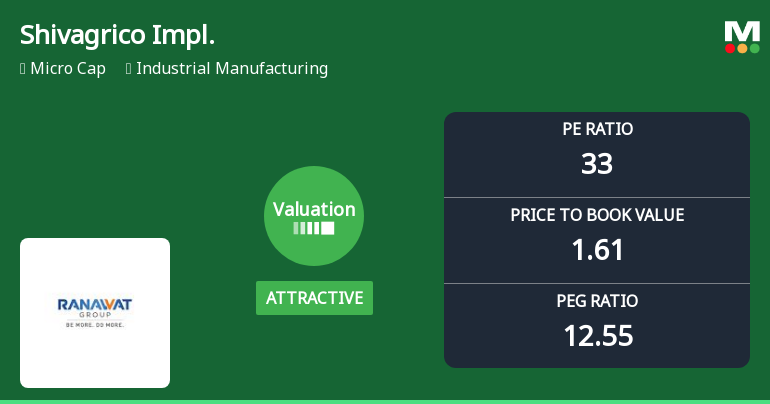
Shivagrico Implements Ltd Valuation Shifts Signal Renewed Price Attractiveness
Shivagrico Implements Ltd has seen a notable shift in its valuation parameters, moving from a very attractive to an attractive rating, despite a challenging fundamental backdrop. The micro-cap industrial manufacturing company’s price-to-earnings (P/E) and price-to-book value (P/BV) ratios now suggest a more compelling price entry point relative to peers and historical averages, even as its overall quality scores remain subdued.
Read full news article Announcements
Announcement under Regulation 30 (LODR)-Newspaper Publication
01-Jun-2026 | Source : BSESubmission of News Paper Cuttings - Publication of financial results for the quarter and year ended on 31.03.2026 as per regulation 33 read with Regulation 47 of SEBI(LODR) Regulations 2015
Format of the Initial Disclosure to be made by an entity identified as a Large Corporate : Annexure A
29-May-2026 | Source : BSEFormat of Initial Disclosure to be made by an entity identified as a Large Corporate.
| Sr. No. | Particulars | Details |
| 1 | Name of Company | Shivagrico Implements Ltd |
| 2 | CIN NO. | L28910MH1979PLC021212 |
| 3 | Outstanding borrowing of company as on 31st March / 31st December as applicable (in Rs cr) | 17.58 |
| 4 | Highest Credit Rating during the previous FY | - |
| 4a | Name of the Credit Rating Agency issuing the Credit Rating mentioned in (4) | Not Applicable |
| 5 | Name of Stock Exchange# in which the fine shall be paid in case of shortfall in the required borrowing under the framework | BSE |
Designation: COMPANY SECRETARY
EmailId: jinaljoshi231@gmail.com
Designation: Chief Financial Officer
EmailId: hranawat@shivagrico.in
Date: 29/05/2026
Note: In terms para of 3.2(ii) of the circular beginning F.Y 2022 in the event of shortfall in the mandatory borrowing through debt securities a fine of 0.2% of the shortfall shall be levied by Stock Exchanges at the end of the two-year block period. Therefore an entity identified as LC shall provide in its initial disclosure for a financial year the name of Stock Exchange to which it would pay the fine in case of shortfall in the mandatory borrowing through debt markets.
Compliances-Reg.24(A)-Annual Secretarial Compliance
29-May-2026 | Source : BSENon Applicability of Regulation 24 A of SEBI(LODR) Regulations 2015 to listed entities who have claimed exemption under regulation 15(2) of SEBI (LODR) Regulations 2015. The Equity share capital of the company is Rs. 501.36 lakhs and Net worth is Rs. 785.69 lakhs
Corporate Actions

No Upcoming Board Meetings

No Dividend history available

No Splits history available

No Bonus history available

No Rights history available
Quality key factors
Valuation key factors
Technicals key factors
 Technical Indicator Scale: Bearish, Mildly Bearish, Sideways, Mildly Bullish, Bullish Turned
 Shareholding Snapshot : Mar 2026
Shareholding Compare (%holding)
Promoters
None
Held by 2 Schemes (0.87%)
Held by 0 FIIs
Vimalchand Moolchandji Jain (16.65%)
Rajesh R Patel (1.16%)
34.44%
Quarterly Results Snapshot (Standalone) - Mar'26 - QoQ

QoQ Growth in quarter ended Mar 2026 is -3.39% vs 11.91% in Dec 2025

QoQ Growth in quarter ended Mar 2026 is 27.27% vs -21.43% in Dec 2025
Half Yearly Results Snapshot (Standalone) - Sep'25
Growth in half year ended Sep 2025 is 20.57% vs -10.17% in Sep 2024
Growth in half year ended Sep 2025 is 40.00% vs 11.11% in Sep 2024
Nine Monthly Results Snapshot (Standalone) - Dec'25
YoY Growth in nine months ended Dec 2025 is 14.14% vs -2.25% in Dec 2024
YoY Growth in nine months ended Dec 2025 is 66.67% vs 87.50% in Dec 2024
Annual Results Snapshot (Standalone) - Mar'26
YoY Growth in year ended Mar 2026 is 9.47% vs -0.28% in Mar 2025
YoY Growth in year ended Mar 2026 is 2.63% vs 442.86% in Mar 2025
About Shivagrico Implements Ltd

Company Coordinates


