
Compare Shivalik Bimetal with Similar Stocks
Stock DNA
Iron & Steel Products
INR 4,247 Cr (Small Cap)
43.00
NA
0.48%
-0.09
20.06%
8.69
Total Returns (Price + Dividend) 
Latest dividend: 2.013734916118905 per share ex-dividend date: Feb-13-2026
Risk Adjusted Returns v/s
Returns Beta

News

Shivalik Bimetal Controls Ltd is Rated Buy
Shivalik Bimetal Controls Ltd is rated 'Buy' by MarketsMOJO, with this rating last updated on 08 June 2026. However, the analysis and financial metrics discussed here reflect the company’s current position as of 12 July 2026, providing investors with the most up-to-date insight into the stock’s performance and outlook.
Read full news article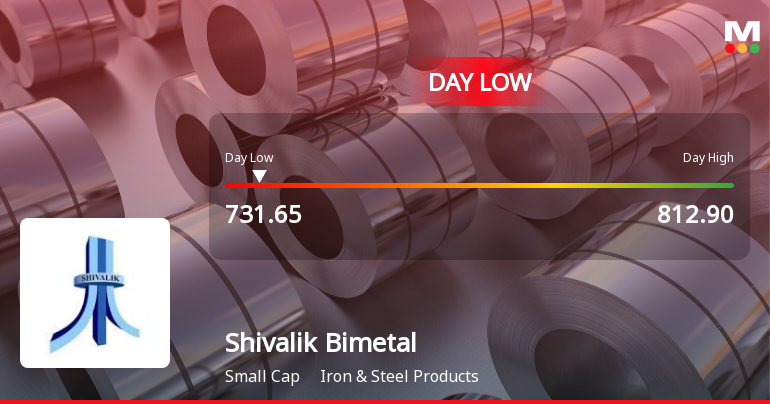
Shivalik Bimetal Controls Ltd Hits Intraday Low Amid Price Pressure
Shivalik Bimetal Controls Ltd experienced a notable intraday decline on 6 Jul 2026, with its stock price falling sharply to an intraday low of Rs 742.4, marking a 6.36% drop from its previous close. This downward movement came despite the broader market’s positive momentum, reflecting specific pressures on the stock within the Iron & Steel Products sector.
Read full news article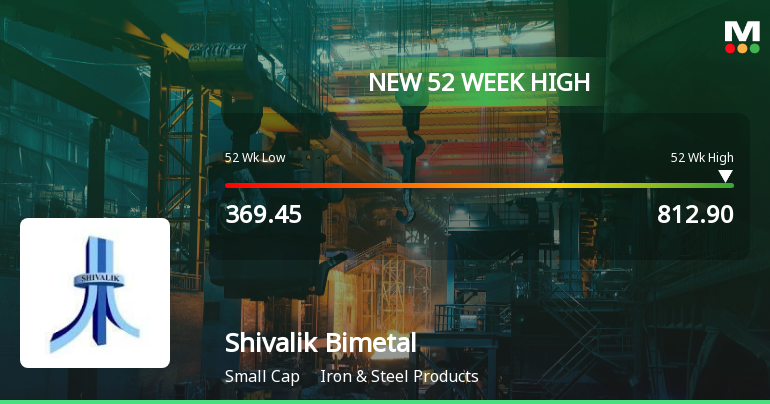
Broad-Based Technical Strength Lifts Shivalik Bimetal Controls Ltd to 52-Week High of Rs 812.9
With a decisive surge to Rs 812.9 on 6 Jul 2026, Shivalik Bimetal Controls Ltd has reached a fresh 52-week and all-time high, extending its impressive rally that has delivered over 51% returns in the past year. This milestone is underpinned by a strong confluence of technical indicators and sustained price momentum that sets the stock apart in the Iron & Steel Products sector.
Read full news article Announcements
Corporate Actions

No Upcoming Board Meetings

Shivalik Bimetal Controls Ltd has declared 100% dividend, ex-date: 13 Feb 26

No Splits history available

Shivalik Bimetal Controls Ltd has announced 1:2 bonus issue, ex-date: 12 Oct 22

No Rights history available
Quality key factors
Valuation key factors
Technicals key factors
 Technical Indicator Scale: Bearish, Mildly Bearish, Sideways, Mildly Bullish, Bullish Turned
 Shareholding Snapshot : Mar 2026
Shareholding Compare (%holding)
Non Institution
None
Held by 9 Schemes (17.58%)
Held by 37 FIIs (1.74%)
O D Finance And Investment Private Limited (15.73%)
Aditya Birla Sun Life Trustee Private Limited A/c Aditya Birla Sun Life Business Cycle Fund (4.37%)
38.01%
Quarterly Results Snapshot (Consolidated) - Mar'26 - QoQ

QoQ Growth in quarter ended Mar 2026 is 21.16% vs -2.31% in Dec 2025
QoQ Growth in quarter ended Mar 2026 is 17.45% vs -10.74% in Dec 2025
Half Yearly Results Snapshot (Consolidated) - Sep'25
Growth in half year ended Sep 2025 is 8.46% vs -0.91% in Sep 2024
Growth in half year ended Sep 2025 is 26.14% vs -9.27% in Sep 2024
Nine Monthly Results Snapshot (Consolidated) - Dec'25
YoY Growth in nine months ended Dec 2025 is 8.60% vs -1.38% in Dec 2024
YoY Growth in nine months ended Dec 2025 is 24.66% vs -4.40% in Dec 2024
Annual Results Snapshot (Consolidated) - Mar'26
YoY Growth in year ended Mar 2026 is 12.30% vs -0.11% in Mar 2025
YoY Growth in year ended Mar 2026 is 24.40% vs -8.56% in Mar 2025
About Shivalik Bimetal Controls Ltd

Company Coordinates


