
Compare Shree Bhavya with Similar Stocks
Dashboard
Weak Long Term Fundamental Strength with an average Return on Capital Employed (ROCE) of 9.52%
- Poor long term growth as Net Sales has grown by an annual rate of 2.37% and Operating profit at 4.28% over the last 5 years
- Low ability to service debt as the company has a high Debt to EBITDA ratio of 6.78 times
Negative results in Mar 26
40.25% of Promoter Shares are Pledged
Stock DNA
Garments & Apparels
INR 21 Cr (Micro Cap)
10.00
52
0.00%
1.74
6.03%
0.58
Total Returns (Price + Dividend) 
Shree Bhavya for the last several years.
Risk Adjusted Returns v/s
Returns Beta

News
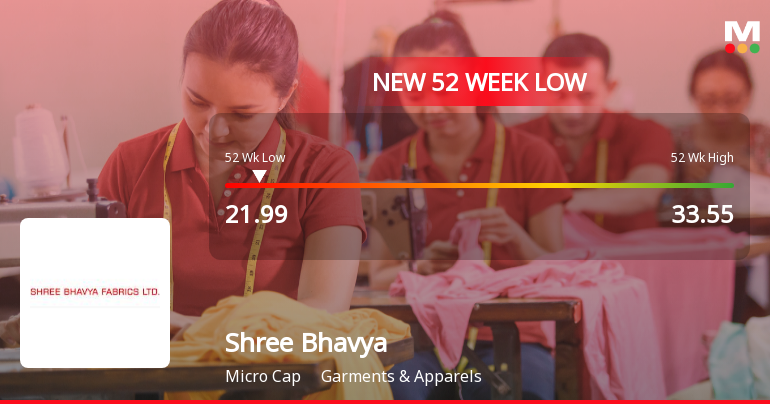
Shree Bhavya Fabrics Ltd Falls to 52-Week Low of Rs 21.99 as Sell-Off Deepens
For the second consecutive session, Shree Bhavya Fabrics Ltd has slipped further, hitting a fresh 52-week low of Rs 21.99 on 9 Jun 2026. This decline comes despite a broader market that has shown some resilience, with the Sensex trading 3.04% above its own 52-week low and gaining 0.37% on the day.
Read full news article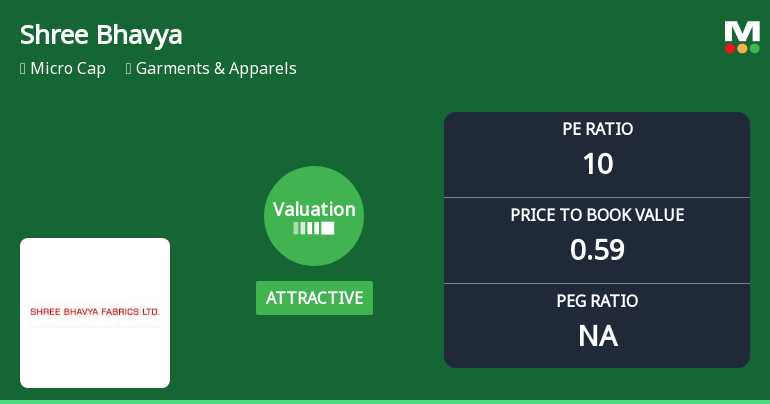
Shree Bhavya Fabrics Ltd: Valuation Shift Signals Renewed Price Attractiveness Amid Mixed Market Returns
Shree Bhavya Fabrics Ltd, a micro-cap player in the Garments & Apparels sector, has seen a notable shift in its valuation parameters, moving from very attractive to attractive territory. Despite a modest decline in share price and mixed returns relative to the Sensex, the company’s improved price-to-earnings and price-to-book ratios suggest a more compelling investment case compared to its peers.
Read full news article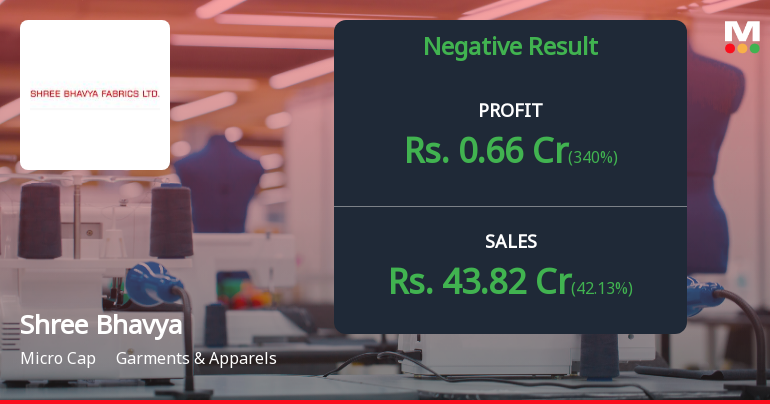
Shree Bhavya Fabrics Q4 FY26: Profit Surge Masks Deeper Margin Concerns
Shree Bhavya Fabrics Ltd., a micro-cap textile processor operating in the garments and apparels sector, reported a sharp sequential recovery in net profit for Q4 FY26, posting ₹0.66 crores compared to ₹0.15 crores in Q3 FY26—a sequential jump of 340%. However, the year-on-year comparison reveals a more sobering reality, with profits declining 26.67% from ₹0.90 crores in Q4 FY25. The stock, currently trading at ₹23.25 with a market capitalisation of ₹22.00 crores, has declined 0.39% following the results announcement, reflecting investor caution despite the quarterly improvement.
Read full news article Announcements
Announcement under Regulation 30 (LODR)-Newspaper Publication
30-May-2026 | Source : BSESubmission of Newspaper Publication for the Audited Financial Results for the Quarter and Year ended on 31st March 2026
APPOINTMENT OF COST AUDITOR
29-May-2026 | Source : BSEIntimation of Appointment of M/s. Kiran J Mehta & Co. as Cost Auditors of the Company for FY 2026-27
Board Meeting Outcome for Outcome Of Board Meeting Held Today As On 29.05.2026
29-May-2026 | Source : BSEOutcome of Board Meeting held today as on 29.05.2026
Corporate Actions

No Upcoming Board Meetings

No Dividend history available

No Splits history available

No Bonus history available

No Rights history available
Quality key factors
Valuation key factors
Technicals key factors
 Technical Indicator Scale: Bearish, Mildly Bearish, Sideways, Mildly Bullish, Bullish Turned
 Shareholding Snapshot : Mar 2026
Shareholding Compare (%holding)
Non Institution
40.2519
Held by 0 Schemes
Held by 0 FIIs
Purushottam R Agarwal Huf (26.24%)
Tanisha Gopalkrishna Goyal (3.63%)
41.11%
Quarterly Results Snapshot (Standalone) - Mar'26 - QoQ

QoQ Growth in quarter ended Mar 2026 is 42.13% vs -32.83% in Dec 2025
QoQ Growth in quarter ended Mar 2026 is 340.00% vs -79.45% in Dec 2025
Half Yearly Results Snapshot (Standalone) - Sep'25

Growth in half year ended Sep 2025 is -12.17% vs 15.93% in Sep 2024
Growth in half year ended Sep 2025 is 26.96% vs 16.16% in Sep 2024
Nine Monthly Results Snapshot (Standalone) - Dec'25
YoY Growth in nine months ended Dec 2025 is -12.74% vs 13.60% in Dec 2024
YoY Growth in nine months ended Dec 2025 is 11.03% vs 20.83% in Dec 2024
Annual Results Snapshot (Standalone) - Mar'26
YoY Growth in year ended Mar 2026 is -11.82% vs 8.26% in Mar 2025
YoY Growth in year ended Mar 2026 is -2.98% vs 21.76% in Mar 2025
About Shree Bhavya Fabrics Ltd

Company Coordinates


