
 Price Point
Compare Sh. Ganesh Elas. with Similar Stocks
ScoreDashboard
Weak Long Term Fundamental Strength with a -31.94% CAGR growth in Operating Profits over the last 5 years
- Company's ability to service its debt is weak with a poor EBIT to Interest (avg) ratio of -0.10
Mojo ParametersStock DNA

Trading & Distributors

INR 10 Cr (Micro Cap)

25.00
NA

0.00%

-0.08

11.80%

2.93
Total ReturnsTotal Returns (Price + Dividend) 
Sh. Ganesh Elas. for the last several years.
Risk Adjusted Returns v/s
Returns Beta
 News & Corporate Actions
News
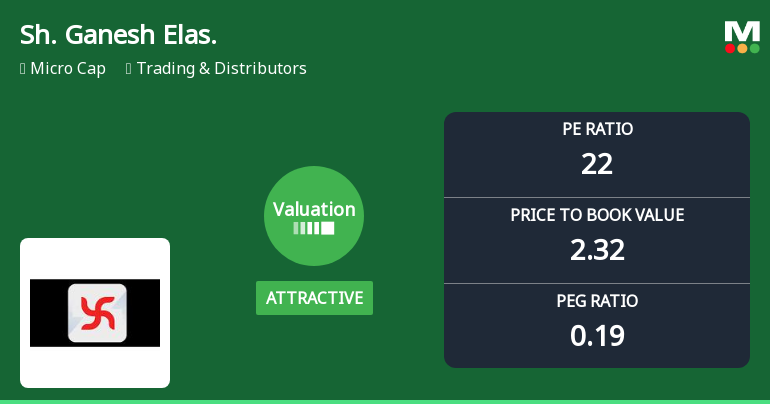
Shree Ganesh Elastoplast Ltd Valuation Shifts Signal Renewed Price Attractiveness
Shree Ganesh Elastoplast Ltd, a micro-cap player in the Trading & Distributors sector, has witnessed a notable shift in its valuation parameters, moving from a risky to an attractive valuation grade. This change comes amid a stable stock price of ₹17.00 and a mixed performance record against the Sensex, prompting investors to reassess its price attractiveness relative to historical and peer benchmarks.
Read full news articleAre Shree Ganesh Elastoplast Ltd latest results good or bad?
Shree Ganesh Elastoplast Ltd's latest financial results for Q4 FY26 indicate a significant quarter-on-quarter recovery in both revenue and net profit, reflecting a sequential revenue growth of 91.67% to ₹2.53 crores and a net profit of ₹0.04 crores, which marks a notable improvement from the previous quarter's loss. The operating margin also turned positive at 2.77%, a substantial recovery from the negative margin reported in the prior quarter. However, while these figures suggest a rebound, they must be viewed in the context of the company's recent history of extreme volatility in performance. The year-on-year revenue growth of 75.69% is influenced by a weak base from the previous year, where the company faced significant losses. The operational metrics, including the operating and PAT margins, remain below levels that would indicate strong financial health, highlighting ongoing challenges in maintaining...
Read full news article Announcements
Reg. 34 (1) Annual Report.
08-Sep-2026 | Source : BSEAnnual Report for FY 2025-26
Fixes Book Closure For Financial Year Ended On March 31 2026
05-Sep-2026 | Source : BSEAGM On Sep 30 2026
05-Sep-2026 | Source : BSEAGM on Sep 30 2026
Corporate Actions

No Upcoming Board Meetings

No Dividend history available

No Splits history available

No Bonus history available

No Rights history available
Key FactorsQuality key factors
Valuation key factors
Technicals key factors
 Technical Indicator Scale: Bearish, Mildly Bearish, Sideways, Mildly Bullish, Bullish Turned Shareholding
Shareholding Snapshot : Jun 2026
Shareholding Compare (%holding)
Non Institution
None
Held by 1 Schemes (0.09%)
Held by 0 FIIs
Devdas N Sheth (5.68%)
Merry Share Fin Limited (11.57%)
63.66%
FinancialQuarterly Results Snapshot (Standalone) - Jun'26 - QoQ
 Compare with Peers
QoQ Growth in quarter ended Jun 2026 is 60.87% vs 91.67% in Mar 2026

QoQ Growth in quarter ended Jun 2026 is 2,375.00% vs 112.50% in Mar 2026

Half Yearly Results Snapshot (Standalone) - Sep'25
Growth in half year ended Sep 2025 is -94.30% vs 91.85% in Sep 2024
Growth in half year ended Sep 2025 is -113.25% vs 27.97% in Sep 2024
Nine Monthly Results Snapshot (Standalone) - Dec'25
YoY Growth in nine months ended Dec 2025 is -87.64% vs 19.39% in Dec 2024
YoY Growth in nine months ended Dec 2025 is -244.44% vs -86.15% in Dec 2024
Annual Results Snapshot (Standalone) - Mar'26
YoY Growth in year ended Mar 2026 is -75.72% vs -16.29% in Mar 2025
YoY Growth in year ended Mar 2026 is 67.35% vs -190.18% in Mar 2025
 Company CV
About Shree Ganesh Elastoplast Ltd










