Shree Ganesh Rem

  • Market Cap: Micro Cap
  • Industry: Pharmaceuticals & Biotechnology
  • ISIN: INE414Y01015
  • NSEID: SGRL
  • BSEID: 540737
INR
666.65
-17.65 (-2.58%)
BSENSE

Sep 02, 10:30 AM

BSE+NSE Vol: 1.07 k

  • Price Points
  • Score
  • Mojo Parameters
  • Total Return
  • News and Corporate Actions
  • Key factors
  • Shareholding
  • Financials
  • CompanyCV
stock-summaryPrice Point
High/Low

1Day

52 Week

Valuation
Technical
Day's Volume

CASH

1.07 k (-79.11%) Volume

Shareholding (Jun 2026)

FII

0.00%

Held by 0 FIIs

DII

0.52%

Held by 0 DIIs

Promoter

72.84%

Why is Shree Ganesh Remedies Ltd falling/rising?

02-Sep-2026

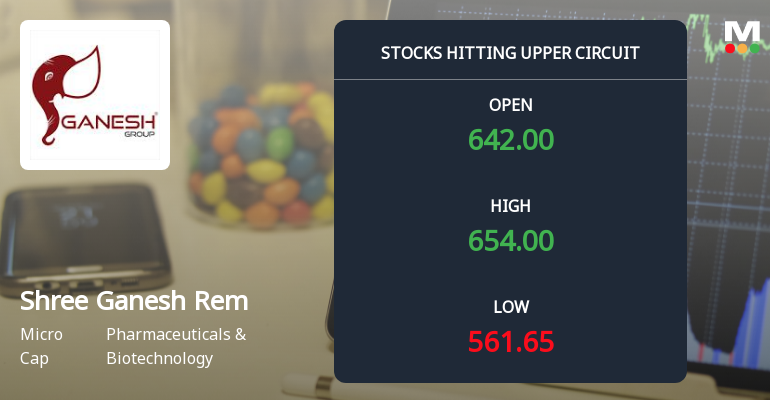
As of 01-Sep, Shree Ganesh Remedies Ltd's stock price has risen to 684.30, up 13.01%, driven by strong recent performance, increased investor participation, and favorable trading conditions. The stock has outperformed its sector and shows a strong bullish trend across various moving averages.

As of 01-Sep, Shree Ganesh Remedies Ltd is experiencing a significant rise in its stock price, currently at 684.30, reflecting an increase of 78.8 or 13.01%. This upward movement can be attributed to several key factors. <BR><BR>Firstly, the stock has shown strong performance over the past week, gaining 35.18%, while the benchmark Sensex has declined by 0.92%. Additionally, the stock has outperformed its sector by 13.42% today alone. The stock has been on a consecutive gain streak for the last five days, accumulating a remarkable 34.95% return during this period.<BR><BR>Moreover, the stock opened with a gain of 2.06% today and reached an intraday high of Rs 700, marking a 15.61% increase. The trading activity has also been robust, with a wide trading range of Rs 82 and a notable rise in delivery volume, which increased by 1767.78% against the five-day average. This indicates rising investor participation and confidence in the stock.<BR><BR>Furthermore, Shree Ganesh Remedies Ltd is trading above its moving averages across various time frames, including the 5-day, 20-day, 50-day, 100-day, and 200-day averages, suggesting a strong bullish trend. The stock has also exhibited high volatility today, with an intraday volatility of 6.22%, reflecting active trading interest.<BR><BR>In summary, the combination of strong recent performance, increased investor participation, and favorable trading conditions are driving the rise in Shree Ganesh Remedies Ltd's stock price.

View full answer

Who are in the management team of Shree Ganesh Rem?

01-Sep-2026

The management team of Shree Ganesh Rem includes Chandubhai Kothia (Chairman & Managing Director), Gunjan and Parth Kothia (Whole-time Directors), and several independent directors: Priyam Shah, Jayesh Savjani, Vaishaliben Vadodariya, and Maulikkumar Sudani, along with Director Parul Sahani. This diverse team oversees the company's governance and strategic direction.

The management team of Shree Ganesh Rem includes the following individuals:<BR><BR>1. **Chandubhai Kothia** - Chairman & Managing Director<BR>2. **Gunjan Chandulal Kothia** - Whole-time Director<BR>3. **Parth Chandulal Kothia** - Whole-time Director<BR>4. **Priyam Surendra Shah** - Independent Director<BR>5. **Jayesh Savjani** - Independent Director<BR>6. **Vaishaliben Kanjibhai Vadodariya** - Independent Director<BR>7. **Parul Sahani** - Director<BR>8. **Maulikkumar Sudani** - Independent Director<BR><BR>This team comprises a mix of executive and independent directors, contributing to the governance and strategic direction of the company.

View full answer

What does Shree Ganesh Rem do?

01-Sep-2026

Shree Ganesh Remedies Ltd manufactures pharmaceutical intermediates and fine chemicals, operating as a Micro Cap company with a market cap of INR 805 Cr. As of June 2026, it reported net sales of 14 Cr and a net profit of 1 Cr.

Overview:<BR>Shree Ganesh Remedies Ltd is engaged in the manufacturing of pharmaceutical intermediates and fine chemicals, operating within the Pharmaceuticals & Biotechnology industry and categorized as a Micro Cap company.<BR><BR>History:<BR>The company was originally incorporated as a Private Limited Company on April 27, 1995, in Ahmedabad, Gujarat, and later converted into a Public Limited Company, changing its name to Shree Ganesh Remedies Limited on July 28, 2017. The latest quarterly results reported net sales and profit for June 2026.<BR><BR>Financial Snapshot:<BR>- Net Sales: 14 Cr (Quarterly Results - Jun 2026)<BR>- Net Profit: 1 Cr (Quarterly Results - Jun 2026)<BR>- Market Cap: INR 805 Cr (Micro Cap)<BR><BR>Key Metrics:<BR>- P/E: 51.00<BR>- Industry P/E: 37<BR>- Dividend Yield: 0.00%<BR>- Debt Equity: 0.03<BR>- Return on Equity: 10.90%<BR>- Price to Book: 4.33<BR><BR>Contact Details:<BR>Address: Plot No 6011, GIDC Ankleshwar Gujarat : 393002 <BR>Tel: 91-2646-227777 <BR>Email: investors@ganeshremedies.com <BR>Website: http://www.ganeshremedies.com

View full answer

Who are the peers of the Shree Ganesh Rem?

01-Sep-2026

Shree Ganesh Rem's peers include Anlon Healthcare, Anuh Pharma, Bafna Pharma, Amanta Healthcar, Zim Laboratories, Kilitch Drugs, Valiant Laborato, Albert David, and Influx Health. In terms of performance, Shree Ganesh Rem has a 1-year return of 3.13%, which is better than Anuh Pharma's -6.06% but lower than Bafna Pharma's 198.53%.

Peers: The peers of Shree Ganesh Rem are Anlon Healthcare, Anuh Pharma, Bafna Pharma, Amanta Healthcar, Zim Laboratories, Kilitch Drugs, Valiant Laborato, Albert David, and Influx Health.<BR><BR>Quality Snapshot: Excellent management risk is observed at Kilitch Drugs, Albert David, and Influx Health, while Average management risk is found at Anlon Healthcare, Anuh Pharma, Shree Ganesh Rem, Amanta Healthcar, Zim Laboratories, and the rest. Below Average management risk is present at Bafna Pharma, Valiant Laborato. In terms of Growth, Excellent growth is seen at Anlon Healthcare, Good growth at Kilitch Drugs and Influx Health, while Below Average growth is noted at Anuh Pharma, Shree Ganesh Rem, Bafna Pharma, Amanta Healthcar, Zim Laboratories, Valiant Laborato, and the rest. Capital Structure ratings show Excellent at Anuh Pharma, Shree Ganesh Rem, Albert David, Good at Kilitch Drugs and Anlon Healthcare, Average at Bafna Pharma, while Below Average is noted at Amanta Healthcar and Valiant Laborato.<BR><BR>Return Snapshot: The peer with the highest 1-year return is Bafna Pharma at 198.53%, while the lowest is Anuh Pharma at -6.06%. Shree Ganesh Rem's 1-year return is 3.13%, which is higher than Anuh Pharma but lower than Bafna Pharma. Additionally, Amanta Healthcar and Influx Health have a six-month return of 0.00%.

View full answer

How big is Shree Ganesh Rem?

01-Sep-2026

As of 31st August, Shree Ganesh Remedies Ltd has a market capitalization of 805.00 Cr, with recent net sales of 98.99 Cr and a net profit of 15.44 Cr.

As of 31st August, Shree Ganesh Remedies Ltd has a market capitalization of 805.00 Cr, classified as a Micro Cap.<BR><BR>In the latest four quarters, the company reported Net Sales of 98.99 Cr and a Net Profit of 15.44 Cr.<BR><BR>The latest annual period for the balance sheet is March 2025, showing Shareholder's Funds of 145.16 Cr and Total Assets of 191.94 Cr.

View full answer

Should I buy, sell or hold Shree Ganesh Remedies Ltd?

18-Aug-2026

Are Shree Ganesh Remedies Ltd latest results good or bad?

15-May-2026

Shree Ganesh Remedies Ltd's latest results show strong sequential revenue growth of 57.27% and a 102.91% increase in net profit quarter-on-quarter. However, year-on-year comparisons reveal a 4.86% decline in net profit and reduced profit margins, indicating underlying profitability challenges despite the revenue recovery.

Shree Ganesh Remedies Ltd's latest results present a mixed picture. On one hand, the company achieved a significant sequential improvement in revenue, reporting ₹33.20 crores for Q4 FY26, which is a 57.27% increase from the previous quarter and a 35.90% increase year-on-year. Additionally, net profit surged by 102.91% quarter-on-quarter to ₹6.27 crores, indicating a strong recovery from the previous quarter.<BR><BR>However, the year-on-year comparison reveals some concerning trends. Despite the revenue growth, net profit decreased by 4.86% compared to the same quarter last year. Furthermore, the operating margin fell sharply to 34.28% from 40.40% in Q4 FY25, and the profit after tax margin also declined to 18.89% from 26.98%. This indicates that while the company is generating more sales, it is struggling with rising costs and profitability pressures.<BR><BR>In summary, while Shree Ganesh Remedies has shown strong revenue growth and a recovery in net profit from the last quarter, the decline in profit margins and year-on-year profit suggests underlying challenges that could impact future performance. Therefore, the results can be seen as good in terms of revenue recovery but concerning regarding profitability.

View full answer

When is the next results date for Shree Ganesh Remedies Ltd?

12-May-2026

The next results date for Shree Ganesh Remedies Ltd is 14 May 2026.

The next results date for Shree Ganesh Remedies Ltd is scheduled for 14 May 2026.

View full answer

How has been the historical performance of Shree Ganesh Rem?

09-Nov-2025

Shree Ganesh Rem's historical performance shows fluctuating trends, with net sales and profits declining from March 2024 to March 2025, despite growth in total assets. Recent results indicate a decrease in profitability and cash flow, contrasting with earlier growth.

Answer:<BR>The historical performance of Shree Ganesh Rem shows a fluctuating trend in key financial metrics over the years.<BR><BR>Breakdown:<BR>Shree Ganesh Rem's net sales decreased from INR 125.90 crore in March 2024 to INR 108.60 crore in March 2025, following a significant rise from INR 49.08 crore in March 2021. The total operating income mirrored this trend, remaining at INR 108.60 crore in March 2025, down from INR 125.90 crore in the previous year. The company's operating profit (PBDIT) also saw a decline to INR 42.95 crore in March 2025 from INR 44.88 crore in March 2024, although it had increased from INR 15.74 crore in March 2021. Profit before tax decreased to INR 31.27 crore in March 2025 from INR 38.16 crore in March 2024, while profit after tax followed suit, dropping to INR 23.07 crore from INR 28.11 crore. The company's total assets grew to INR 191.94 crore in March 2025 from INR 170.94 crore in March 2024, and total liabilities increased to INR 191.94 crore from INR 170.94 crore in the same period. Cash flow from operating activities remained stable at INR 30.00 crore in both March 2025 and March 2024, but the net cash outflow was recorded at INR 5.00 crore in March 2025, contrasting with a net inflow of INR 7.00 crore in March 2024. Overall, while Shree Ganesh Rem has shown growth in certain areas over the years, recent performance indicates a decline in profitability and cash flow.

View full answer

Is Shree Ganesh Rem overvalued or undervalued?

13-Oct-2025

As of October 10, 2025, Shree Ganesh Rem is fairly valued with a PE ratio of 29.32 and an EV to EBITDA of 17.00, but has underperformed with a year-to-date stock return of -21.58% compared to the Sensex's 5.58%.

As of 10 October 2025, the valuation grade for Shree Ganesh Rem has moved from expensive to fair. The company is currently fairly valued, with a PE ratio of 29.32, an EV to EBITDA of 17.00, and a ROCE of 19.10%. In comparison to its peers, Sun Pharma has a higher PE ratio of 34.96 and an EV to EBITDA of 23.7, while Dr. Reddy's Labs shows a more attractive valuation with a PE of 18.58 and an EV to EBITDA of 12.26.<BR><BR>Despite the recent valuation adjustment, Shree Ganesh Rem has underperformed in the short term, with a year-to-date stock return of -21.58% compared to a Sensex return of 5.58%. This performance suggests that while the stock may be fairly valued, it faces challenges in the current market environment.

View full answer

Is Shree Ganesh Rem technically bullish or bearish?

26-Sep-2025

As of September 25, 2025, the market trend has shifted to a moderately strong bearish stance, indicated by bearish daily moving averages and Bollinger Bands, despite mixed signals from the MACD and KST across different time frames.

As of 25 September 2025, the technical trend has changed from mildly bearish to bearish. The current stance is bearish with a moderate strength. Key indicators driving this include the daily moving averages indicating bearishness, and both the weekly and monthly Bollinger Bands also signaling bearish trends. The MACD shows a mildly bullish signal on the weekly but is mildly bearish on the monthly, suggesting mixed signals across time frames. The KST aligns with this by being mildly bullish weekly and mildly bearish monthly. Overall, the bearish trend is reinforced by the recent price decline and underperformance compared to the Sensex over multiple periods.

View full answer

Who are the top shareholders of the Shree Ganesh Rem?

17-Jul-2025

The top shareholder of Shree Ganesh Rem is Chandulal Manubhai Kothia, holding 48.76%, followed by public shareholder Gunjan Jayantibhai Dhorajiya at 1.7%. Individual investors own 24.89%, with no pledged promoter holdings or mutual fund investments.

The top shareholders of Shree Ganesh Rem include the promoters, with Chandulal Manubhai Kothia being the largest shareholder, holding 48.76% of the company. The highest public shareholder is Gunjan Jayantibhai Dhorajiya, who holds 1.7%. Additionally, individual investors collectively hold 24.89% of the shares. There is also one foreign institutional investor (FII) that holds a very small percentage, at 0.01%. Notably, there are no pledged promoter holdings and no mutual funds currently invested in the company.

View full answer

What is the bonus history of the Shree Ganesh Rem?

06-Jun-2025

Shree Ganesh Remedies' recent bonus history includes a 1:5 bonus announced on November 1, 2021, with a record date of November 2, 2021, and a previous 3:26 bonus issued on October 6, 2020, with a record date of October 7, 2020.

Shree Ganesh Remedies has a notable bonus history. The most recent bonus issue was a 1:5 ratio, which was announced with an ex-date of November 1, 2021, and the record date was November 2, 2021. Prior to that, the company had a bonus issue with a ratio of 3:26, which had an ex-date of October 6, 2020, and a record date of October 7, 2020. If you have any more questions about the company or its financials, feel free to ask!

View full answer

Has Shree Ganesh Rem declared dividend?

06-Jun-2025

Shree Ganesh Remedies Ltd has declared a 5% dividend, amounting to 0.5 per share, with an ex-date of September 7, 2023. Despite this, the recent total returns show declines over shorter periods, while longer-term performance remains strong.

Shree Ganesh Remedies Ltd has declared a 5% dividend.<BR><BR>Dividend Details:<BR>- Percentage announced: 5%<BR>- Amount per share: 0.5<BR>- Ex-date: 07 Sep 2023<BR><BR>Dividend Yield: 0%<BR><BR>Total Returns by Period:<BR>In the last 6 months, the price return was -14.84%, with a dividend return of 0%, resulting in a total return of -14.84%.<BR><BR>Over the past year, the price return was -24.98%, with a dividend return of 0%, leading to a total return of -24.98%.<BR><BR>In the 2-year period, the price return was 62.3%, with a dividend return of 0.14%, resulting in a total return of 62.44%.<BR><BR>For the 3-year period, the price return was 142.1%, with a dividend return of 0.45%, leading to a total return of 142.55%.<BR><BR>In the 4-year period, the price return was 127.4%, with a dividend return of 0.85%, resulting in a total return of 128.25%.<BR><BR>Over the last 5 years, the price return was 940.28%, with a dividend return of 6.40%, leading to a total return of 946.68%.<BR><BR>Overall, while Shree Ganesh Remedies Ltd has declared a dividend, the recent total returns show significant declines over shorter periods, contrasting with strong performance over the longer term. The dividend yield remains at 0%, indicating that the recent dividends have not contributed to returns in the short term.

View full answer
iScoreScore
Click here to find our call on this stock
Strong Sell
Sell
Hold
Buy
Strong Buy

Dashboard

1

Poor long term growth as Net Sales has grown by an annual rate of 13.40% and Operating profit at 10.23% over the last 5 years

 
2

With a fall in Net Sales of -41.79%, the company declared Very Negative results in Jun 26

3

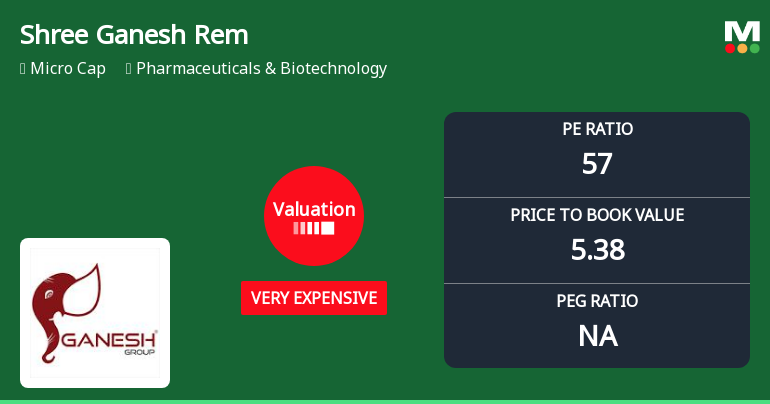
With ROE of 10.9, it has a Very Expensive valuation with a 5.4 Price to Book Value

stock-summaryMojo Parameters

Mojo Parameters

Loading Valuation Snapshot...

Stock DNA

stock-summary
Industry

Pharmaceuticals & Biotechnology

stock-summary
Market cap

INR 856 Cr (Micro Cap)

stock-summary
P/E

57.00

stock-summary
Industry P/E

37

stock-summary
Dividend Yield

0.00%

stock-summary
Debt Equity

0.03

stock-summary
Return on Equity

10.90%

stock-summary
Price to Book

5.38

Revenue and Profits:
Net Sales:
14 Cr
(Quarterly Results - Jun 2026)
Net Profit:
1 Cr
stock-summaryTotal Returns
Total Returns (Price + Dividend) stock-summary
Dividend Yield (0%)
TimePeriod
Price Return
Dividend Return
Total Return
3 Months
2.44%
0%
2.44%
6 Months
32.98%
0%
32.98%
1 Year
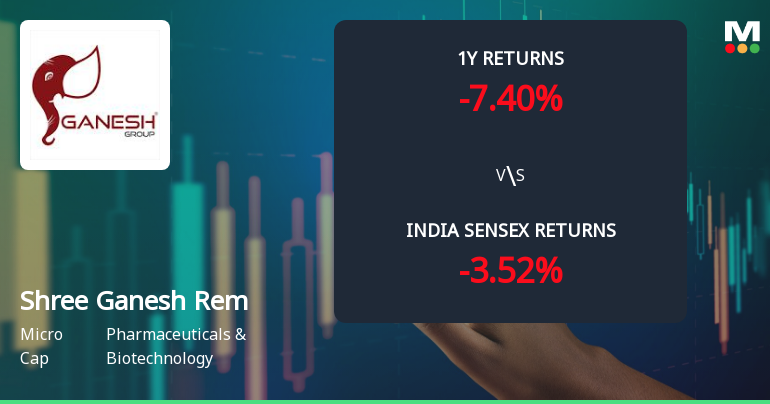
12.57%
0%
12.57%
2 Years
-14.06%
0%
-14.06%
3 Years
48.71%
0%
48.71%
4 Years
192.81%
0.21%
193.02%
5 Years
118.94%
0.30%
119.24%

Latest dividend: 0.5 per share ex-dividend date: Sep-07-2023

Risk Adjusted Returns v/s stock-summary
Returns Beta
Icon
Beta has not been calculated since enough price history is not available
stock-summaryNews & Corporate Actions

Announcements stock-summary

Announcement under Regulation 30 (LODR)-Newspaper Publication

21-Aug-2026 | Source : BSE

Newspaper Publication for Notice of Annual General Meeting

Reg. 34 (1) Annual Report.

20-Aug-2026 | Source : BSE

Annual Report FY 2025-26

Announcement under Regulation 30 (LODR)-Newspaper Publication

13-Aug-2026 | Source : BSE

Newspaper Publication

Corporate Actions stock-summary

stock-summary
BOARD MEETING

No Upcoming Board Meetings

stock-summary
DIVIDEND

Shree Ganesh Remedies Ltd has declared 5% dividend, ex-date: 07 Sep 23

stock-summary
SPLITS

No Splits history available

stock-summary
BONUS

Shree Ganesh Remedies Ltd has announced 1:5 bonus issue, ex-date: 01 Nov 21

stock-summary
RIGHTS

Shree Ganesh Remedies Ltd has announced 7:100 rights issue, ex-date: 03 Feb 23

stock-summaryKey Factors

Quality key factors stock-summary

Factor
Value
Sales Growth (5y)
13.40%
EBIT Growth (5y)
10.23%
EBIT to Interest (avg)
15.60
Debt to EBITDA (avg)
0.97
Net Debt to Equity (avg)
0.03
Sales to Capital Employed (avg)
0.78
Tax Ratio
26.31%
Dividend Payout Ratio
0
Pledged Shares
0
Institutional Holding
0.52%
ROCE (avg)
20.65%
ROE (avg)
13.40%

Valuation key factors

Factor
Value
P/E Ratio
57
Industry P/E
37
Price to Book Value
5.38
EV to EBIT
42.81
EV to EBITDA
28.35
EV to Capital Employed
5.25
EV to Sales
8.91
PEG Ratio
NA
Dividend Yield
NA
ROCE (Latest)
14.64%
ROE (Latest)
10.90%

Technicals key factors

Indicator
Weekly
Monthly
MACD
Mildly Bearish
Bullish
RSI
No Signal
Bearish
Bollinger Bands
Bullish
Bullish
Moving Averages
Bullish (Daily)
KST
Mildly Bearish
Mildly Bullish
Dow Theory
Mildly Bearish
Mildly Bearish
OBV
No Trend
Bearish
stock-summary Technical Indicator Scale: Bearish, Mildly Bearish, Sideways, Mildly Bullish, Bullish  Turned 
stock-summaryShareholding
Shareholding Snapshot : Jun 2026stock-summary
Shareholding Compare (%holding) stock-summary
Majority shareholders

Promoters

Pledged Promoter Holdings

None

Mutual Funds

Held by 2 Schemes (0.0%)

FIIs

Held by 0 FIIs

Promoter with highest holding

Chandulal Manubhai Kothia (48.76%)

Highest Public shareholder

Gunjan Jayantibhai Dhorajiya (1.7%)

Individual Investors Holdings

24.63%

stock-summaryFinancial
[
  {
    "link": "quarterly",
    "btn_text": "All Quarterly Results",
    "header": "Quarterly Results Snapshot (Consolidated) - Jun'26 - YoY",
    "rhs": [
      {
        "prefix": "Net Sales ",
        "suffix": "YoY Growth in quarter ended Jun 2026 is -41.79% vs -0.44% in Jun 2025",
        "dir": -1
      },
      {
        "prefix": "Consolidated Net Profit ",
        "suffix": "YoY Growth in quarter ended Jun 2026 is -67.54% vs -25.81% in Jun 2025",
        "dir": -1
      }
    ],
    "table": {
      "header": [
        "Jun'26",
        "Jun'25",
        "Change(%)"
      ],
      "body": [
        {
          "field": "Net Sales",
          "val1": "14.36",
          "val2": "24.67",
          "chgp": "-41.79%",
          "chgp_class": "negative"
        },
        {
          "field": "Operating Profit (PBDIT) excl Other Income",
          "val1": "3.35",
          "val2": "7.30",
          "chgp": "-54.11%",
          "chgp_class": "negative"
        },
        {
          "field": "Interest",
          "val1": "0.32",
          "val2": "0.94",
          "chgp": "-65.96%",
          "chgp_class": "positive"
        },
        {
          "field": "Exceptional Items",
          "val1": "0.00",
          "val2": "0.00",
          "chgp": "",
          "chgp_class": "neutral"
        },
        {
          "field": "Consolidate Net Profit",
          "val1": "1.12",
          "val2": "3.45",
          "chgp": "-67.54%",
          "chgp_class": "negative"
        },
        {
          "field": "Operating Profit Margin (Excl OI)",
          "val1": "23.33%",
          "val2": "29.59%",
          "chgp": "-6.26%",
          "chgp_class": "negative"
        }
      ]
    }
  },
  {
    "link": "half-yearly",
    "btn_text": "All Half Yearly Results",
    "header": "Half Yearly Results Snapshot (Consolidated) - Sep'25",
    "rhs": [
      {
        "prefix": "Net Sales ",
        "suffix": "Not Applicable: The company has declared_date for only one period",
        "dir": 0
      },
      {
        "prefix": "Consolidated Net Profit ",
        "suffix": "Not Applicable: The company has declared_date for only one period",
        "dir": 0
      }
    ],
    "table": {
      "header": [
        "Sep'25",
        "Sep'24",
        "Change(%)"
      ],
      "body": [
        {
          "field": "Net Sales",
          "val1": "54.98",
          "val2": "57.11",
          "chgp": "-3.73%",
          "chgp_class": "negative"
        },
        {
          "field": "Operating Profit (PBDIT) excl Other Income",
          "val1": "16.91",
          "val2": "19.43",
          "chgp": "-12.97%",
          "chgp_class": "negative"
        },
        {
          "field": "Interest",
          "val1": "1.95",
          "val2": "0.76",
          "chgp": "156.58%",
          "chgp_class": "negative"
        },
        {
          "field": "Exceptional Items",
          "val1": "0.00",
          "val2": "0.00",
          "chgp": "",
          "chgp_class": "neutral"
        },
        {
          "field": "Consolidate Net Profit",
          "val1": "8.40",
          "val2": "11.05",
          "chgp": "-23.98%",
          "chgp_class": "negative"
        },
        {
          "field": "Operating Profit Margin (Excl OI)",
          "val1": "30.76%",
          "val2": "34.02%",
          "chgp": "-3.26%",
          "chgp_class": "negative"
        }
      ]
    }
  },
  {
    "link": "nine-monthly",
    "btn_text": "All Nine Monthly Results",
    "header": "Nine Monthly Results Snapshot (Consolidated) - Dec'25",
    "rhs": [
      {
        "prefix": "Net Sales ",
        "suffix": "YoY Growth in nine months ended Dec 2025 is -9.59% vs 65.90% in Dec 2024",
        "dir": -1
      },
      {
        "prefix": "Consolidated Net Profit ",
        "suffix": "YoY Growth in nine months ended Dec 2025 is -30.24% vs 72.28% in Dec 2024",
        "dir": -1
      }
    ],
    "table": {
      "header": [
        "Dec'25",
        "Dec'24",
        "Change(%)"
      ],
      "body": [
        {
          "field": "Net Sales",
          "val1": "76.09",
          "val2": "84.16",
          "chgp": "-9.59%",
          "chgp_class": "negative"
        },
        {
          "field": "Operating Profit (PBDIT) excl Other Income",
          "val1": "23.65",
          "val2": "29.33",
          "chgp": "-19.37%",
          "chgp_class": "negative"
        },
        {
          "field": "Interest",
          "val1": "2.69",
          "val2": "1.15",
          "chgp": "133.91%",
          "chgp_class": "negative"
        },
        {
          "field": "Exceptional Items",
          "val1": "0.00",
          "val2": "0.00",
          "chgp": "",
          "chgp_class": "neutral"
        },
        {
          "field": "Consolidate Net Profit",
          "val1": "11.49",
          "val2": "16.47",
          "chgp": "-30.24%",
          "chgp_class": "negative"
        },
        {
          "field": "Operating Profit Margin (Excl OI)",
          "val1": "31.08%",
          "val2": "34.85%",
          "chgp": "-3.77%",
          "chgp_class": "negative"
        }
      ]
    }
  },
  {
    "link": "annual",
    "btn_text": "All Annual Results",
    "header": "Annual Results Snapshot (Consolidated) - Mar'26",
    "rhs": [
      {
        "prefix": "Net Sales ",
        "suffix": "YoY Growth in year ended Mar 2026 is 0.64% vs -13.74% in Mar 2025",
        "dir": 1
      },
      {
        "prefix": "Consolidated Net Profit ",
        "suffix": "YoY Growth in year ended Mar 2026 is -23.02% vs -17.93% in Mar 2025",
        "dir": -1
      }
    ],
    "table": {
      "header": [
        "Mar'26",
        "Mar'25",
        "Change(%)"
      ],
      "body": [
        {
          "field": "Net Sales",
          "val1": "109.29",
          "val2": "108.60",
          "chgp": "0.64%",
          "chgp_class": "positive"
        },
        {
          "field": "Operating Profit (PBDIT) excl Other Income",
          "val1": "35.02",
          "val2": "39.22",
          "chgp": "-10.71%",
          "chgp_class": "negative"
        },
        {
          "field": "Interest",
          "val1": "3.56",
          "val2": "2.11",
          "chgp": "68.72%",
          "chgp_class": "negative"
        },
        {
          "field": "Exceptional Items",
          "val1": "0.00",
          "val2": "0.00",
          "chgp": "",
          "chgp_class": "neutral"
        },
        {
          "field": "Consolidate Net Profit",
          "val1": "17.76",
          "val2": "23.07",
          "chgp": "-23.02%",
          "chgp_class": "negative"
        },
        {
          "field": "Operating Profit Margin (Excl OI)",
          "val1": "32.04%",
          "val2": "36.11%",
          "chgp": "-4.07%",
          "chgp_class": "negative"
        }
      ]
    }
  }
]

Quarterly Results Snapshot (Consolidated) - Jun'26 - YoYstock-summary

Jun'26
Jun'25
Change(%)
Net Sales
14.36
24.67
-41.79%
Operating Profit (PBDIT) excl Other Income
3.35
7.30
-54.11%
Interest
0.32
0.94
-65.96%
Exceptional Items
0.00
0.00
Consolidate Net Profit
1.12
3.45
-67.54%
Operating Profit Margin (Excl OI)
23.33%
29.59%
-6.26%
Values in Rs Cr.
Direction Arrows
Net Sales

YoY Growth in quarter ended Jun 2026 is -41.79% vs -0.44% in Jun 2025

Direction Arrows
Consolidated Net Profit

YoY Growth in quarter ended Jun 2026 is -67.54% vs -25.81% in Jun 2025

Half Yearly Results Snapshot (Consolidated) - Sep'25stock-summary

Sep'25
Sep'24
Change(%)
Net Sales
54.98
57.11
-3.73%
Operating Profit (PBDIT) excl Other Income
16.91
19.43
-12.97%
Interest
1.95
0.76
156.58%
Exceptional Items
0.00
0.00
Consolidate Net Profit
8.40
11.05
-23.98%
Operating Profit Margin (Excl OI)
30.76%
34.02%
-3.26%
Values in Rs Cr.
Net Sales

Not Applicable: The company has declared_date for only one period

Consolidated Net Profit

Not Applicable: The company has declared_date for only one period

Nine Monthly Results Snapshot (Consolidated) - Dec'25stock-summary

Dec'25
Dec'24
Change(%)
Net Sales
76.09
84.16
-9.59%
Operating Profit (PBDIT) excl Other Income
23.65
29.33
-19.37%
Interest
2.69
1.15
133.91%
Exceptional Items
0.00
0.00
Consolidate Net Profit
11.49
16.47
-30.24%
Operating Profit Margin (Excl OI)
31.08%
34.85%
-3.77%
Values in Rs Cr.
Direction Arrows
Net Sales

YoY Growth in nine months ended Dec 2025 is -9.59% vs 65.90% in Dec 2024

Direction Arrows
Consolidated Net Profit

YoY Growth in nine months ended Dec 2025 is -30.24% vs 72.28% in Dec 2024

Annual Results Snapshot (Consolidated) - Mar'26stock-summary

Mar'26
Mar'25
Change(%)
Net Sales
109.29
108.60
0.64%
Operating Profit (PBDIT) excl Other Income
35.02
39.22
-10.71%
Interest
3.56
2.11
68.72%
Exceptional Items
0.00
0.00
Consolidate Net Profit
17.76
23.07
-23.02%
Operating Profit Margin (Excl OI)
32.04%
36.11%
-4.07%
Values in Rs Cr.
Direction Arrows
Net Sales

YoY Growth in year ended Mar 2026 is 0.64% vs -13.74% in Mar 2025

Direction Arrows
Consolidated Net Profit

YoY Growth in year ended Mar 2026 is -23.02% vs -17.93% in Mar 2025

stock-summaryCompany CV
About Shree Ganesh Remedies Ltd stock-summary
stock-summary
Shree Ganesh Remedies Ltd
Micro Cap
Pharmaceuticals & Biotechnology
Shree Ganesh Remedies Limited was originally incorporated as a Private Limited Company with the name "Shree Ganesh Remedies Private Limited" at Ahmedabad, Gujarat on April 27, 1995. Subsequently the Company was converted into a Public Limited and the name of the Company was changed to "Shree Ganesh Remedies Limited" on July 28, 2017. The Company, a part of Ganesh Group has carved for itself a niche in the industry of manufacturing pharmaceutical intermediates and fine chemicals.
Company Coordinates stock-summary
Company Details
Plot No 6011, GIDC Ankleshwar Gujarat : 393002
stock-summary
Tel: 91-2646-227777
stock-summary
investors@ganeshremedies.com
Registrar Details
Bigshare Services Pvt Ltd , E-2 , Ansa Industrial Estate, Saki Vihar Road, Saki Naka, Andheri (E), Mumbai