
Compare Sh. Karthik Pap. with Similar Stocks
Dashboard
With HIgh Debt (Debt-Equity Ratio at 7.98 times)- the company has a Weak Long Term Fundamental Strength
- Poor long term growth as Net Sales has grown by an annual rate of 27.51% and Operating profit at 0% over the last 5 years
- The company is Net-Debt Free
Flat results in Mar 26
With ROCE of 0.9, it has a Expensive valuation with a 1.4 Enterprise value to Capital Employed
Underperformed the market in the last 1 year
Stock DNA
Paper, Forest & Jute Products
INR 14 Cr (Micro Cap)
452.00
17
0.00%
7.98
1.01%
4.58
Total Returns (Price + Dividend) 
Sh. Karthik Pap. for the last several years.
Risk Adjusted Returns v/s
Returns Beta

News
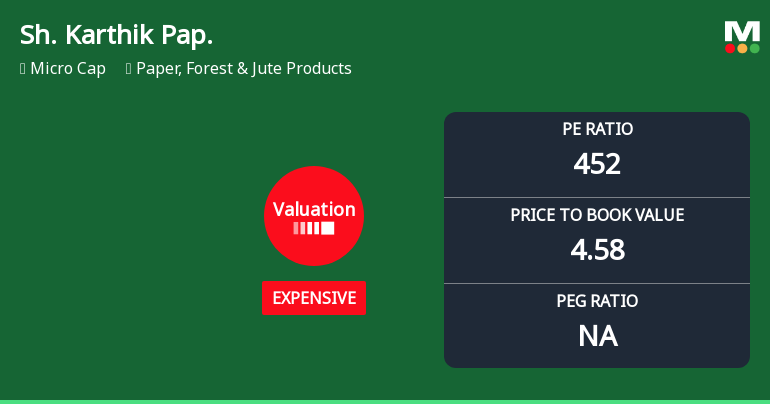
Shree Karthik Papers Ltd Valuation Shifts Signal Elevated Price Risk
Shree Karthik Papers Ltd has seen a marked shift in its valuation parameters, with its price-to-earnings (P/E) ratio soaring to 451.63 and price-to-book value (P/BV) rising to 4.58, signalling a transition from fair to expensive territory. This valuation surge contrasts sharply with both historical averages and peer benchmarks, raising questions about the stock’s price attractiveness amid subdued financial performance and a challenging sector backdrop.
Read full news article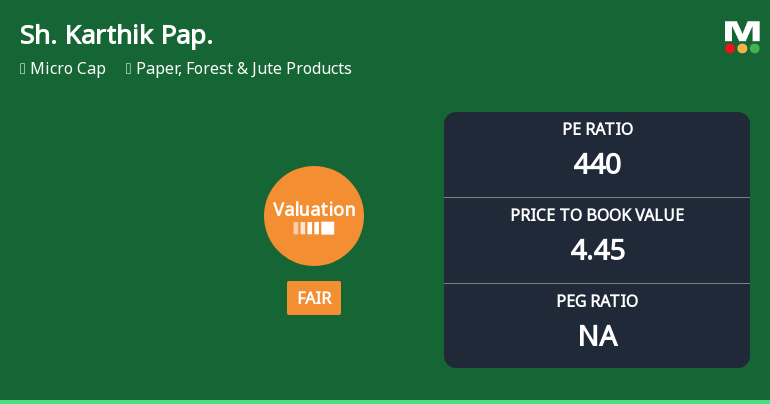
Shree Karthik Papers Ltd Valuation Shifts to Fair Amidst Challenging Market Conditions
Shree Karthik Papers Ltd, a micro-cap player in the Paper, Forest & Jute Products sector, has seen a notable shift in its valuation parameters, moving from an expensive to a fair valuation grade. Despite a recent downgrade in its Mojo Grade to Strong Sell, the company’s price-to-earnings (P/E) and price-to-book value (P/BV) ratios suggest a more balanced price attractiveness relative to its historical and peer benchmarks.
Read full news article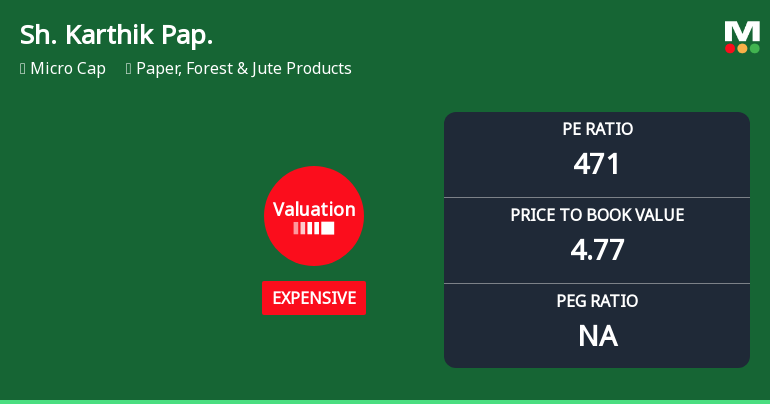
Shree Karthik Papers Ltd Valuation Shifts Signal Elevated Price Risk
Shree Karthik Papers Ltd, a micro-cap player in the Paper, Forest & Jute Products sector, has seen a marked shift in its valuation parameters, moving from fair to expensive territory. With a price-to-earnings (P/E) ratio soaring to 470.74 and a price-to-book value (P/BV) at 4.77, investors face heightened valuation risk amid subdued profitability metrics and a challenging sector backdrop.
Read full news article Announcements
Board Meeting Intimation for Quarterly Unaudited Financial Results For The Quarter Ended 30/06/2026
16-Jul-2026 | Source : BSEShree Karthik Papers Ltdhas informed BSE that the meeting of the Board of Directors of the Company is scheduled on 13/08/2026 inter alia to consider and approve Intimation of BOard Meeting to consider and approve the quarterly financial results for the quarter ended 30.06/2026 be taken on record.
Compliances-Reg.24(A)-Annual Secretarial Compliance
14-Jul-2026 | Source : BSEAnnual Secretarial Compliance Report received fromMs. V N Vennila Practising Company Secretary Coimbatore is filed for taking on record
Compliances-Reg.24(A)-Annual Secretarial Compliance
12-Jul-2026 | Source : BSEAnnual Secretarial Compliance report received from the Practising Company Secretary is filed for taking on record.
Corporate Actions

13 Aug 2026

No Dividend history available

No Splits history available

No Bonus history available

No Rights history available
Quality key factors
Valuation key factors
Technicals key factors
 Technical Indicator Scale: Bearish, Mildly Bearish, Sideways, Mildly Bullish, Bullish Turned
 Shareholding Snapshot : Jun 2026
Shareholding Compare (%holding)
Promoters
None
Held by 2 Schemes (0.14%)
Held by 1 FIIs (0.5%)
Mrs. Selvambal (74.46%)
K Sundara Sharma (1.33%)
3.47%
Quarterly Results Snapshot (Standalone) - Mar'26 - YoY

YoY Growth in quarter ended Mar 2026 is 17.97% vs -2.94% in Mar 2025
YoY Growth in quarter ended Mar 2026 is 178.38% vs 0.00% in Mar 2025
Half Yearly Results Snapshot (Standalone) - Sep'25
Growth in half year ended Sep 2025 is 8.18% vs -16.82% in Sep 2024

Growth in half year ended Sep 2025 is 5.41% vs 12.12% in Sep 2024
Nine Monthly Results Snapshot (Standalone) - Dec'25
YoY Growth in nine months ended Dec 2025 is 6.49% vs -13.18% in Dec 2024
YoY Growth in nine months ended Dec 2025 is -86.36% vs -37.14% in Dec 2024
Annual Results Snapshot (Standalone) - Mar'26
YoY Growth in year ended Mar 2026 is 9.31% vs -10.86% in Mar 2025
YoY Growth in year ended Mar 2026 is 78.95% vs -44.12% in Mar 2025
About Shree Karthik Papers Ltd

Company Coordinates


