
Compare Shree Mfg. Co. with Similar Stocks
Dashboard
With a Negative Book Value, the company has a Weak Long Term Fundamental Strength
- Poor long term growth as Net Sales has grown by an annual rate of % and Operating profit at 0% over the last 5 years
- The company has a negative book value of Rs 2.68 crore
Flat results in Mar 26
Risky - Negative EBITDA
Consistent Underperformance against the benchmark over the last 3 years
Total Returns (Price + Dividend) 
Shree Mfg. Co. for the last several years.
Risk Adjusted Returns v/s
Returns Beta

News

Markets Rally, But Shree Manufacturing Company Ltd Sinks to 52-Week Low in Stock-Specific Sell-Off
While broader indices showed mixed trends, Shree Manufacturing Company Ltd slipped to a fresh 52-week low of Rs 10 on 19 Jun 2026, marking a significant decline from its 52-week high of Rs 24.89. This drop comes amid persistent underperformance and deteriorating fundamentals, raising questions about the stock’s near-term outlook.
Read full news article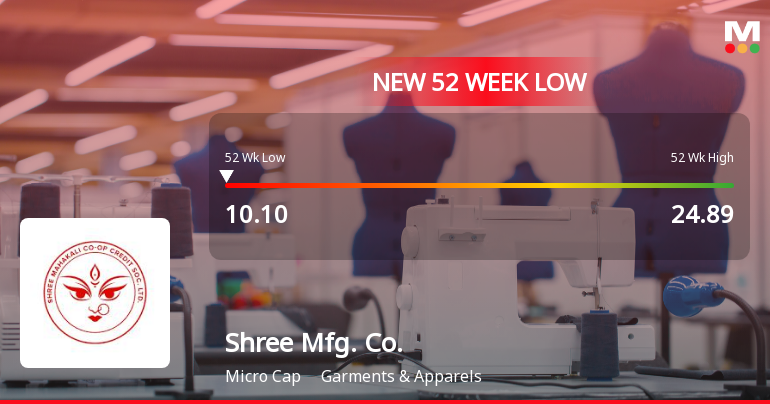
Shree Manufacturing Company Ltd Falls to 52-Week Low of Rs 10.1 as Sell-Off Deepens
For the seventh consecutive session, Shree Manufacturing Company Ltd has closed lower, culminating in a fresh 52-week low of Rs 10.1 on 18 Jun 2026. This extended decline has dragged the stock down by 24.06% over this period, significantly underperforming its sector and broader market indices.
Read full news article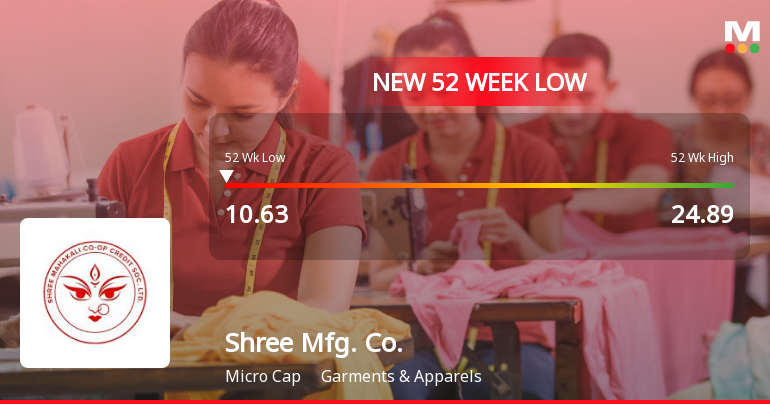
Shree Manufacturing Company Ltd Falls to 52-Week Low of Rs 10.63 as Sell-Off Deepens
For the sixth consecutive session, Shree Manufacturing Company Ltd has closed lower, culminating in a fresh 52-week low of Rs 10.63 on 17 Jun 2026. This marks a steep 20.08% decline over this period, underscoring sustained selling pressure despite a broadly positive market backdrop.
Read full news article Announcements
Declaration For Reg. 23(9) Along With Audited Results For Mar 2026
27-May-2026 | Source : BSEDeclaration for Reg. 23(9) along with Audited Results for Mar 2026
Results For Mar 2026
27-May-2026 | Source : BSEResults for Mar 2026
Reg. 32 For Mar 2026 Along With Audited Results For Mar 2026
27-May-2026 | Source : BSEReg. 32 for Mar 2026 along with Audited Results for Mar 2026
Corporate Actions

No Upcoming Board Meetings

No Dividend history available

No Splits history available

No Bonus history available

No Rights history available
Quality key factors
Valuation key factors
Technicals key factors
 Technical Indicator Scale: Bearish, Mildly Bearish, Sideways, Mildly Bullish, Bullish Turned
 Shareholding Snapshot : Mar 2026
Shareholding Compare (%holding)
Promoters
None
Held by 0 Schemes
Held by 0 FIIs
Edge Consultancy Services Llp (74.8%)
Meghani Hetal Manoj (8.43%)
19.37%
Quarterly Results Snapshot (Standalone) - Dec'25 - YoY
YoY Growth in quarter ended Dec 2025 is 0.00% vs 0.00% in Dec 2024

YoY Growth in quarter ended Dec 2025 is 0.00% vs 80.00% in Dec 2024
Half Yearly Results Snapshot (Standalone) - Sep'25
Growth in half year ended Sep 2025 is 0.00% vs 0.00% in Sep 2024

Growth in half year ended Sep 2025 is 0.00% vs -200.00% in Sep 2024
Nine Monthly Results Snapshot (Standalone) - Dec'25
YoY Growth in nine months ended Dec 2025 is 0.00% vs 0.00% in Dec 2024
YoY Growth in nine months ended Dec 2025 is 0.00% vs 0.00% in Dec 2024
Annual Results Snapshot (Standalone) - Mar'26
YoY Growth in year ended Mar 2026 is 0.00% vs 0.00% in Mar 2025
YoY Growth in year ended Mar 2026 is 0.00% vs 100.00% in Mar 2025
About Shree Manufacturing Company Ltd

Company Coordinates


