
Compare Shree Metalloys with Similar Stocks
Stock DNA
Non Banking Financial Company (NBFC)
INR 22 Cr (Micro Cap)
15.00
24
0.00%
-0.32
12.51%
1.89
Total Returns (Price + Dividend) 
Shree Metalloys for the last several years.
Risk Adjusted Returns v/s
Returns Beta

News
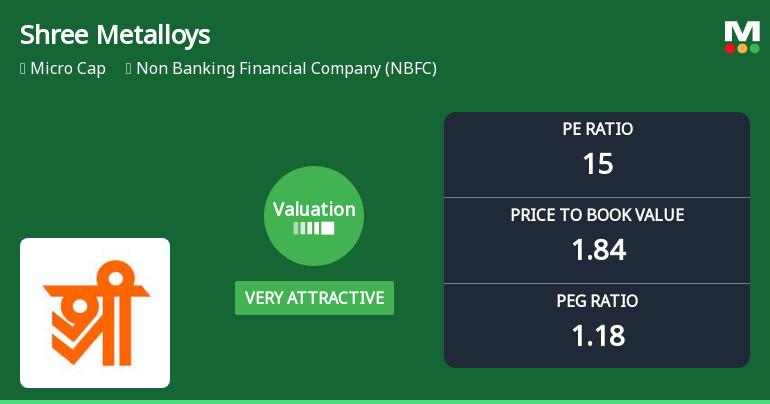
Shree Metalloys Ltd Valuation Shifts Signal Renewed Price Attractiveness
Shree Metalloys Ltd, a micro-cap player in the Non Banking Financial Company (NBFC) sector, has seen a notable shift in its valuation parameters, moving from a fair to a very attractive rating. Despite recent price pressures and a challenging year-to-date return, the company’s improved price-to-earnings and price-to-book value metrics suggest a compelling entry point for investors willing to look beyond short-term volatility.
Read full news articleAre Shree Metalloys Ltd latest results good or bad?
Shree Metalloys Ltd's latest financial results for the quarter ending March 2026 present a mixed operational picture. The company experienced a sequential decline in net sales of 11.42%, totaling ₹27.15 crores, which nearly matched the previous year's performance. This indicates a stagnation in revenue growth, raising questions about the sustainability of its topline. On the profitability front, Shree Metalloys achieved its highest operating margin in twelve quarters at 2.98%, reflecting effective cost management and possibly better pricing on metal scrap sales despite lower volumes. This margin expansion allowed the company to maintain a net profit of ₹0.46 crores, unchanged from the previous quarter, while showing a year-on-year improvement of 12.20%. The PAT margin also saw an increase to 1.69%, further highlighting the company's ability to enhance profitability metrics even amidst declining sales. The...
Read full news article
Shree Metalloys Ltd Upgraded to Sell on Technical Improvement Despite Weak Fundamentals
Shree Metalloys Ltd, a micro-cap player in the Non Banking Financial Company (NBFC) sector, has seen its investment rating upgraded from Strong Sell to Sell as of 1 June 2026. This change reflects a nuanced shift in the company’s technical outlook amid persistent fundamental weaknesses, prompting a reassessment of its risk and return profile by market analysts.
Read full news article Announcements
Result- Audited Finucial Result For 31.03.2026
30-May-2026 | Source : BSETHIS TO INFORM YOU UNDER REGULATION 30 & REGULATION 33 SEBI(LODR) REGULATION 2015 A MEETING OF BOARD OF DIRECTOR OF THE COMPANY WAS HELD ON SATURDAY 30TH MAY 2026 AT THE REGISTERED OFFICE OF THE COMPANY AT 05:00 P.M. AND CONCLUDE AT 6:00 P.M.
Board Meeting Outcome for Outcome Of Meeting Of The Board Of Directors.
30-May-2026 | Source : BSEThis is to inform you under Regulation 30 & Regulation 33 of SEBI(LODR) Regulations2015 a Meeting of Board of Directors of the Company was held on Saturday 30th May 2026 at the Registered Office of the Company at 05:00P.M. and Conclude at 06:25 P.M. The members of Those Charged With Governance (TCWG) reviewed and took note of the following matters: 1. Considered and approved the audited financial results of the Company for the quarter ended on 31ST MARCH 2026. 2. Considered and appointed of Mr Rajendra singh Rao as an internal auditor of the Company for the F.Y.2026-27. and other as per attached outcome
Board Meeting Intimation for Notice Of Meeting Of The Board Of Directors
22-May-2026 | Source : BSEShree Metalloys Ltdhas informed BSE that the meeting of the Board of Directors of the Company is scheduled on 30/05/2026 inter alia to consider and approve This is to inform you under Regulation 29 and any other Regulation of SEBI (Listing Obligations and Disclosure Requirements) Regulations 2015 a meeting of the Board of Directors of the Company will be held on Saturday 30th May 2026 at the Registered Office of the Company at 05.00 P.M. to transact following business: 1. To consider and approve Audited Financial Results of the Company for the Quarter ended on 31st March 2026. 2. Any other item with the permission of the Chair and Majority of Directors
Corporate Actions

30 May 2048

No Dividend history available

No Splits history available

No Bonus history available

No Rights history available
Quality key factors
Valuation key factors
Technicals key factors
 Technical Indicator Scale: Bearish, Mildly Bearish, Sideways, Mildly Bullish, Bullish Turned
 Shareholding Snapshot : Mar 2026
Shareholding Compare (%holding)
Promoters
None
Held by 0 Schemes
Held by 0 FIIs
Radheshyam Kabra Huf (12.0%)
Neha Ramprakash Kabra (5.58%)
23.76%
Quarterly Results Snapshot (Standalone) - Mar'26 - QoQ

QoQ Growth in quarter ended Mar 2026 is -11.42% vs 7.36% in Dec 2025
QoQ Growth in quarter ended Mar 2026 is 0.00% vs 15.00% in Dec 2025
Half Yearly Results Snapshot (Standalone) - Sep'25
Growth in half year ended Sep 2025 is -16.93% vs 5.54% in Sep 2024
Growth in half year ended Sep 2025 is 1.96% vs 82.14% in Sep 2024
Nine Monthly Results Snapshot (Standalone) - Dec'25
YoY Growth in nine months ended Dec 2025 is -0.38% vs 14.53% in Dec 2024
YoY Growth in nine months ended Dec 2025 is 12.64% vs 190.00% in Dec 2024
Annual Results Snapshot (Standalone) - Mar'26
YoY Growth in year ended Mar 2026 is -0.44% vs 10.21% in Mar 2025
YoY Growth in year ended Mar 2026 is 13.28% vs 150.98% in Mar 2025
About Shree Metalloys Ltd

Company Coordinates


