
Compare Shree Mfg. Co. with Similar Stocks
Dashboard
With a Negative Book Value, the company has a Weak Long Term Fundamental Strength
- Poor long term growth as Net Sales has grown by an annual rate of % and Operating profit at 0% over the last 5 years
- The company has a negative book value of Rs 2.68 crore
Flat results in Mar 26
Risky - Negative EBITDA
Below par performance in long term as well as near term
Total Returns (Price + Dividend) 
Shree Mfg. Co. for the last several years.
Risk Adjusted Returns v/s
Returns Beta

News
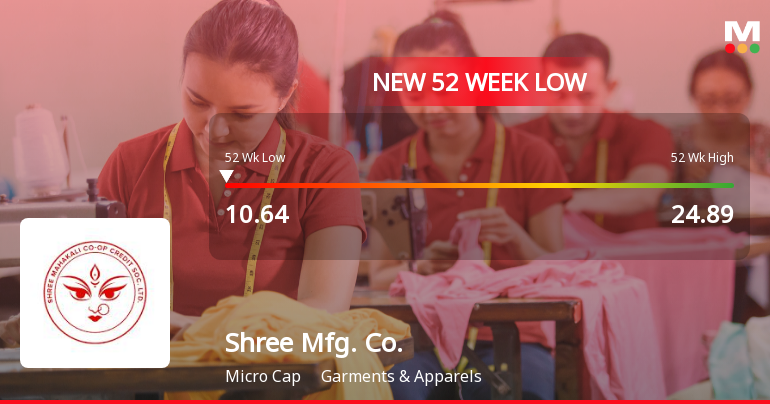
Five Consecutive Losses Push Shree Manufacturing Company Ltd to a New 52-Week Low
For the fifth consecutive session, Shree Manufacturing Company Ltd closed lower, slipping to a fresh 52-week low of Rs 10.64 on 16 Jun 2026, marking a 20% decline over this losing streak.
Read full news article
Shree Manufacturing Company Ltd Downgraded to Strong Sell Amid Technical and Fundamental Weaknesses
Shree Manufacturing Company Ltd, a micro-cap player in the Garments & Apparels sector, has seen its investment rating downgraded from Sell to Strong Sell as of 3 June 2026. This change reflects deteriorating technical indicators, stagnant financial performance, weak valuation metrics, and a faltering quality assessment, signalling heightened risk for investors.
Read full news article Announcements
Declaration For Reg. 23(9) Along With Audited Results For Mar 2026
27-May-2026 | Source : BSEDeclaration for Reg. 23(9) along with Audited Results for Mar 2026
Results For Mar 2026
27-May-2026 | Source : BSEResults for Mar 2026
Reg. 32 For Mar 2026 Along With Audited Results For Mar 2026
27-May-2026 | Source : BSEReg. 32 for Mar 2026 along with Audited Results for Mar 2026
Corporate Actions

No Upcoming Board Meetings

No Dividend history available

No Splits history available

No Bonus history available

No Rights history available
Quality key factors
Valuation key factors
Technicals key factors
 Technical Indicator Scale: Bearish, Mildly Bearish, Sideways, Mildly Bullish, Bullish Turned
 Shareholding Snapshot : Mar 2026
Shareholding Compare (%holding)
Promoters
None
Held by 0 Schemes
Held by 0 FIIs
Edge Consultancy Services Llp (74.8%)
Meghani Hetal Manoj (8.43%)
19.37%
Quarterly Results Snapshot (Standalone) - Dec'25 - YoY
YoY Growth in quarter ended Dec 2025 is 0.00% vs 0.00% in Dec 2024

YoY Growth in quarter ended Dec 2025 is 0.00% vs 80.00% in Dec 2024
Half Yearly Results Snapshot (Standalone) - Sep'25
Growth in half year ended Sep 2025 is 0.00% vs 0.00% in Sep 2024

Growth in half year ended Sep 2025 is 0.00% vs -200.00% in Sep 2024
Nine Monthly Results Snapshot (Standalone) - Dec'25
YoY Growth in nine months ended Dec 2025 is 0.00% vs 0.00% in Dec 2024
YoY Growth in nine months ended Dec 2025 is 0.00% vs 0.00% in Dec 2024
Annual Results Snapshot (Standalone) - Mar'26
YoY Growth in year ended Mar 2026 is 0.00% vs 0.00% in Mar 2025
YoY Growth in year ended Mar 2026 is 0.00% vs 100.00% in Mar 2025
About Shree Manufacturing Company Ltd

Company Coordinates


