
Compare Sh. Rama Multi. with Similar Stocks
Total Returns (Price + Dividend) 
Sh. Rama Multi. for the last several years.
Risk Adjusted Returns v/s
Returns Beta

News
Shree Rama Multi-Tech Ltd is Rated Strong Sell
Shree Rama Multi-Tech Ltd is rated Strong Sell by MarketsMOJO, with this rating last updated on 11 May 2026. However, the analysis and financial metrics presented here reflect the company’s current position as of 03 June 2026, providing investors with the most recent and relevant data to assess the stock’s outlook.
Read full news article
Shree Rama Multi-Tech Ltd is Rated Strong Sell
Shree Rama Multi-Tech Ltd is rated Strong Sell by MarketsMOJO, with this rating last updated on 11 May 2026. However, the analysis and financial metrics discussed here reflect the stock’s current position as of 23 May 2026, providing investors with an up-to-date perspective on the company’s performance and outlook.
Read full news article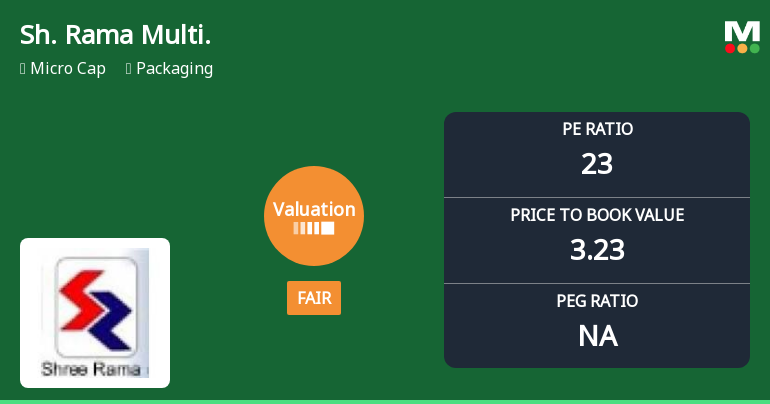
Shree Rama Multi-Tech Ltd Valuation Shifts Amid Mixed Market Performance
Shree Rama Multi-Tech Ltd, a micro-cap player in the packaging sector, has experienced a notable shift in its valuation parameters, moving from an attractive to a fair rating. This change reflects evolving market perceptions amid rising price-to-earnings (P/E) and price-to-book value (P/BV) ratios, positioning the stock differently against its peers and historical benchmarks.
Read full news article Announcements
Commencement Of Commercial Production By New Tubing Machine At Plant Moti-Bhoyan
03-Jun-2026 | Source : BSEDisclosure as per Reg. 30 of SEBI (LODR) Reg. 2015 attached herewith
Compliances-Reg.24(A)-Annual Secretarial Compliance
26-May-2026 | Source : BSESubmission of Secretarial Compliance Report pursuant to Reg. 24 A of SEBI (LODR) Reg. 2015 as per attached
Audited Financial Results For The Quarter And Year Ended On 31St March 2026
09-May-2026 | Source : BSEAs per attached filed
Corporate Actions

No Upcoming Board Meetings

No Dividend history available

No Splits history available

No Bonus history available

Shree Rama Multi-Tech Ltd has announced 11:10 rights issue, ex-date: 30 May 23
Quality key factors
Valuation key factors
Technicals key factors
 Technical Indicator Scale: Bearish, Mildly Bearish, Sideways, Mildly Bullish, Bullish Turned
 Shareholding Snapshot : Mar 2026
Shareholding Compare (%holding)
Promoters
None
Held by 0 Schemes
Held by 0 FIIs
Nirma Chemical Works Private Limited (56.53%)
Jayesh H Patel (2.79%)
32.43%
Quarterly Results Snapshot (Standalone) - Mar'26 - QoQ

QoQ Growth in quarter ended Mar 2026 is 3.97% vs -3.50% in Dec 2025
QoQ Growth in quarter ended Mar 2026 is -14.65% vs -22.87% in Dec 2025
Half Yearly Results Snapshot (Standalone) - Sep'25
Growth in half year ended Sep 2025 is 22.58% vs 9.13% in Sep 2024

Growth in half year ended Sep 2025 is 53.00% vs 110.42% in Sep 2024
Nine Monthly Results Snapshot (Standalone) - Dec'25
YoY Growth in nine months ended Dec 2025 is 19.18% vs 13.23% in Dec 2024
YoY Growth in nine months ended Dec 2025 is 35.93% vs 122.81% in Dec 2024
Annual Results Snapshot (Standalone) - Mar'26
YoY Growth in year ended Mar 2026 is 15.63% vs 16.37% in Mar 2025
YoY Growth in year ended Mar 2026 is -51.78% vs 415.56% in Mar 2025
About Shree Rama Multi-Tech Ltd

Company Coordinates


