
Compare Shree Rama News. with Similar Stocks
Dashboard
With a Negative Book Value, the company has a Weak Long Term Fundamental Strength
- Low ability to service debt as the company has a high Debt to EBITDA ratio of 376.27 times
- The company has been able to generate a Return on Equity (avg) of 1.70% signifying low profitability per unit of shareholders funds
The company has declared Negative results for the last 4 consecutive quarters
Risky - Negative Operating Profits
Underperformed the market in the last 1 year
Stock DNA
Paper, Forest & Jute Products
INR 420 Cr (Micro Cap)
NA (Loss Making)
16
0.00%
-4.54
41.09%
-5.13
Total Returns (Price + Dividend) 
Shree Rama News. for the last several years.
Risk Adjusted Returns v/s
Returns Beta

News

Shree Rama Newsprint Ltd is Rated Strong Sell
Shree Rama Newsprint Ltd is rated Strong Sell by MarketsMOJO, with this rating last updated on 20 April 2026. However, the analysis and financial metrics presented here reflect the company’s current position as of 04 June 2026, providing investors with the latest insights into the stock’s fundamentals, valuation, financial trends, and technical outlook.
Read full news articleAre Shree Rama Newsprint Ltd latest results good or bad?
Shree Rama Newsprint Ltd's latest financial results for Q4 FY26 reveal significant operational challenges. The company reported a net loss of ₹9.93 crores, which marks a substantial decline compared to the same quarter last year. Revenue also fell to ₹7.87 crores, reflecting a year-on-year decrease of over 30%. This decline in revenue is notable as it represents the lowest quarterly figure in over two years, indicating a troubling trend in both market share and demand within the newsprint sector. The operating margin for the quarter turned negative at -22.11%, the worst performance seen in at least seven quarters, highlighting severe operational inefficiencies. Furthermore, the interest coverage ratio has dropped to -0.19 times, indicating that the company is unable to service its debt from operational cash flows, which raises concerns about its financial sustainability. The balance sheet shows a negative...
Read full news article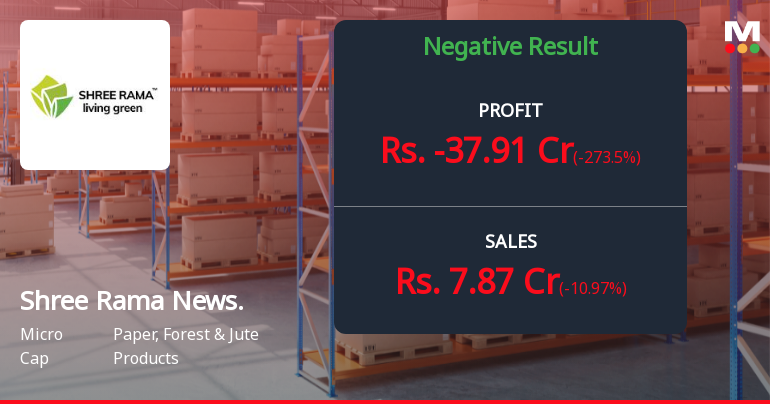
Shree Rama Newsprint Q4 FY26: Mounting Losses Signal Deepening Distress
Shree Rama Newsprint Ltd., India's largest private sector newsprint manufacturer, reported a widening net loss of ₹9.93 crores for Q4 FY26, marking a 49.55% deterioration from the ₹6.64 crores loss in Q4 FY25. The quarter-on-quarter comparison reveals an even starker picture, with losses expanding 24.75% from ₹7.96 crores in Q3 FY26, underscoring the company's inability to stem its financial haemorrhaging.
Read full news article Announcements
Shareholder Meeting / Postal Ballot-Notice of Postal Ballot
02-Jun-2026 | Source : BSEPursuant to Regulation 30 of Securities and Exchange Board of India (Listing Obligation and Disclosure Requirements) Regulations 2015 we hereby submit notice of postal ballot dated 25.05.2026 seeking approval of the members for resolution as set out in the attached notice.
Results - Financial Results For Mar 31 2026
25-May-2026 | Source : BSEPursuant to Regulation 30 and 33 of Securities and Exchange Board of India (Listing Obligation and Disclosure Requirements) 2015 we hereby submit Audited Financial Results of Shree Rama Newsprint Limited (Company) for the quarter and financial year ended 31st March 2026.
Board Meeting Outcome for Outcome Of Board Meeting Of Shree Rama Newsprint Limited
25-May-2026 | Source : BSEPursuant to Regulation 30 & 33 of the Securities & Exchange Board of India (Listing Obligations and Disclosure Requirements) Regulations 2015 we hereby submit outcome of meeting of Board of Directors of Shree Rama Newsprint Limited.
Corporate Actions

No Upcoming Board Meetings

No Dividend history available

No Splits history available

No Bonus history available

No Rights history available
Quality key factors
Valuation key factors
Technicals key factors
 Technical Indicator Scale: Bearish, Mildly Bearish, Sideways, Mildly Bullish, Bullish Turned
 Shareholding Snapshot : Mar 2026
Shareholding Compare (%holding)
Promoters
None
Held by 15 Schemes (0.03%)
Held by 7 FIIs (0.42%)
Riddhi Siddhi Gluco Biols Limited (74.76%)
Icici Bank Ltd (1.52%)
18.45%
Quarterly Results Snapshot (Standalone) - Mar'26 - QoQ

QoQ Growth in quarter ended Mar 2026 is -10.97% vs 29.43% in Dec 2025
QoQ Growth in quarter ended Mar 2026 is -273.50% vs 0.49% in Dec 2025
Half Yearly Results Snapshot (Standalone) - Sep'25
Growth in half year ended Sep 2025 is -21.49% vs -1.92% in Sep 2024
Growth in half year ended Sep 2025 is -0.94% vs 12.28% in Sep 2024
Nine Monthly Results Snapshot (Standalone) - Dec'25
YoY Growth in nine months ended Dec 2025 is -24.29% vs -3.59% in Dec 2024

YoY Growth in nine months ended Dec 2025 is 69.66% vs -203.85% in Dec 2024
Annual Results Snapshot (Standalone) - Mar'26
YoY Growth in year ended Mar 2026 is -25.86% vs -6.19% in Mar 2025
YoY Growth in year ended Mar 2026 is 35.52% vs -119.79% in Mar 2025
About Shree Rama Newsprint Ltd

Company Coordinates


