
Compare Shree TirupatiBa with Similar Stocks
Dashboard
Weak Long Term Fundamental Strength with a -25.17% CAGR growth in Operating Profits over the last 5 years
- Low ability to service debt as the company has a high Debt to EBITDA ratio of 6.10 times
- The company has been able to generate a Return on Equity (avg) of 6.14% signifying low profitability per unit of shareholders funds
Flat results in Mar 26
Underperformed the market in the last 1 year
Total Returns (Price + Dividend) 
Shree TirupatiBa for the last several years.
Risk Adjusted Returns v/s
Returns Beta

News

Shree Tirupati Balajee Agro Trading Co. Ltd is Rated Sell
Shree Tirupati Balajee Agro Trading Co. Ltd is rated 'Sell' by MarketsMOJO, with this rating last updated on 01 June 2026. However, the analysis and financial metrics discussed here reflect the stock's current position as of 11 June 2026, providing investors with the latest insights into its performance and outlook.
Read full news article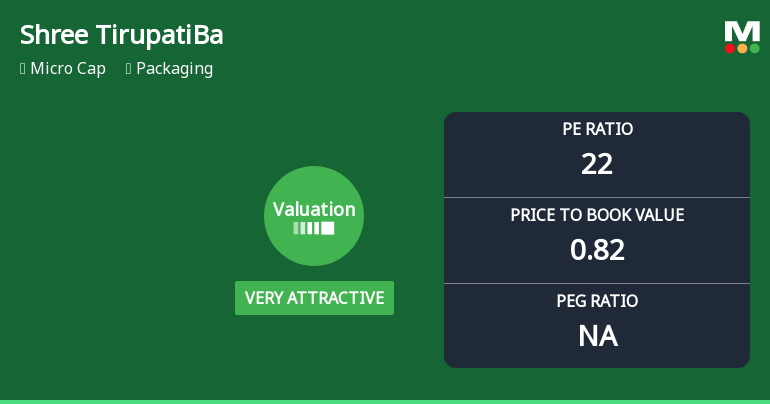
Shree Tirupati Balajee Agro Trading Co. Ltd: Valuation Shifts Signal Renewed Price Attractiveness
Shree Tirupati Balajee Agro Trading Co. Ltd has witnessed a notable shift in its valuation parameters, moving from an attractive to a very attractive rating. This change, driven primarily by its price-to-earnings (P/E) and price-to-book value (P/BV) ratios, suggests a renewed price attractiveness relative to its historical averages and peer group within the packaging sector.
Read full news articleAre Shree Tirupati Balajee Agro Trading Co. Ltd latest results good or bad?
Shree Tirupati Balajee Agro Trading Co. Ltd's latest financial results for Q4 FY26 reflect a challenging operational environment. The company reported net sales of ₹129.56 crores, which represents a year-on-year decline of 6.82% and a significant sequential drop of 24.59% from the previous quarter. This decline in revenue indicates ongoing difficulties in maintaining market share and pricing power amidst competitive pressures. The net profit for the quarter was ₹3.66 crores, showing a year-on-year decrease of 35.34%. Despite this, there was a notable sequential increase in net profit compared to the previous quarter, which raises questions about the sustainability of this improvement. The profit after tax margin fell to 2.86%, down from 5.01% in the same quarter last year, highlighting challenges in converting revenue into profit effectively. Operating margins, excluding other income, improved slightly to...
Read full news article Announcements
Disclosure Under Regulation 30 Of The SEBI (Listing Obligations And Disclosure Requirements) Regulations 2015 - Order Imposing Penalty Passed By The Assessment Unit Income Tax Department
08-Jun-2026 | Source : BSEIntimation under Regulation 30 of SEBI LODR regarding imposition of penalty
Announcement under Regulation 30 (LODR)-Credit Rating
06-Jun-2026 | Source : BSEIntimation regarding Credit Rating assigned by Infomerics Valuation and Ratings Ltd.
Submission Of Reply On Clarification Sought For Discrepancy Regarding Non-Disclosure Of Board Meeting Commencement And Conclusion Time In The Audited Standalone & Consolidated Financial Results For The Quarter And Financial Year Ended 31St March 2026
01-Jun-2026 | Source : BSESubmission of Reply on Clarification Sought
Corporate Actions

No Upcoming Board Meetings

No Dividend history available

No Splits history available

No Bonus history available

No Rights history available
Quality key factors
Valuation key factors
Technicals key factors
 Technical Indicator Scale: Bearish, Mildly Bearish, Sideways, Mildly Bullish, Bullish Turned
 Shareholding Snapshot : Mar 2026
Shareholding Compare (%holding)
Promoters
None
Held by 0 Schemes
Held by 3 FIIs (0.1%)
Binod Kumar Agarwal (65.42%)
L7 Hitech Private Limited (3.84%)
23.44%
Quarterly Results Snapshot (Consolidated) - Mar'26 - QoQ

QoQ Growth in quarter ended Mar 2026 is -24.59% vs 20.43% in Dec 2025

QoQ Growth in quarter ended Mar 2026 is 2,950.00% vs -94.26% in Dec 2025
Half Yearly Results Snapshot (Consolidated) - Sep'25
Growth in half year ended Sep 2025 is -10.38% vs 48.97% in Sep 2024
Growth in half year ended Sep 2025 is -46.87% vs -9.88% in Sep 2024
Nine Monthly Results Snapshot (Consolidated) - Dec'25
YoY Growth in nine months ended Dec 2025 is -0.43% vs 23.40% in Dec 2024
YoY Growth in nine months ended Dec 2025 is -62.78% vs -0.85% in Dec 2024
Annual Results Snapshot (Consolidated) - Mar'26
YoY Growth in year ended Mar 2026 is -1.73% vs 8.19% in Mar 2025
YoY Growth in year ended Mar 2026 is -56.60% vs -13.38% in Mar 2025
About Shree Tirupati Balajee Agro Trading Co. Ltd

Company Coordinates


