
Compare Shreeoswal Seeds with Similar Stocks
Dashboard
Weak Long Term Fundamental Strength with a -3.04% CAGR growth in Net Sales over the last 5 years
- Low ability to service debt as the company has a high Debt to EBITDA ratio of 0.41 times
- The company has been able to generate a Return on Equity (avg) of 8.51% signifying low profitability per unit of shareholders funds
Flat results in Mar 26
Below par performance in long term as well as near term
Stock DNA
Other Agricultural Products
INR 97 Cr (Micro Cap)
13.00
13
0.00%
0.09
14.15%
1.89
Total Returns (Price + Dividend) 
Shreeoswal Seeds for the last several years.
Risk Adjusted Returns v/s
Returns Beta

News

Shreeoswal Seeds & Chemicals Ltd is Rated Sell
Shreeoswal Seeds & Chemicals Ltd is rated Sell by MarketsMOJO, with this rating last updated on 02 June 2026. However, the analysis and financial metrics discussed here reflect the stock’s current position as of 08 July 2026, providing investors with the most up-to-date view of the company’s fundamentals, returns, and technical outlook.
Read full news article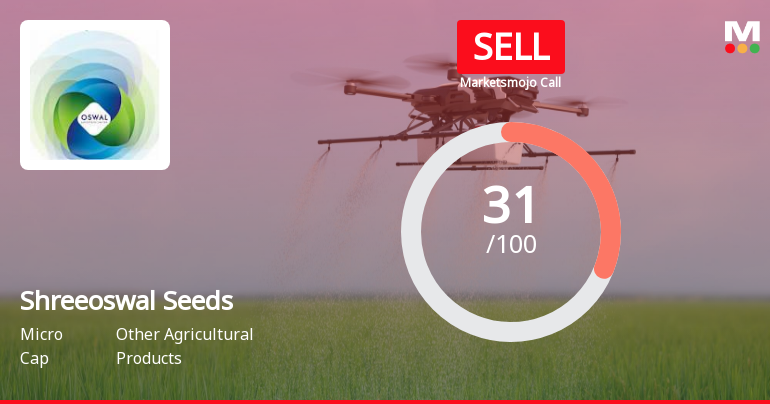
Shreeoswal Seeds & Chemicals Ltd is Rated Sell
Shreeoswal Seeds & Chemicals Ltd is rated 'Sell' by MarketsMOJO, with this rating last updated on 02 June 2026. However, the analysis and financial metrics discussed here reflect the stock's current position as of 27 June 2026, providing investors with the latest insights into its performance and outlook.
Read full news article
Shreeoswal Seeds & Chemicals Ltd is Rated Sell
Shreeoswal Seeds & Chemicals Ltd is rated 'Sell' by MarketsMOJO. This rating was last updated on 02 June 2026, reflecting a change from a previous 'Strong Sell' status. However, all fundamentals, returns, and financial metrics discussed here are current as of 16 June 2026, providing investors with an up-to-date analysis of the stock's position.
Read full news article Announcements
ShreeOswal Seeds And Chemicals Limited - Clarification - Financial Results
18-Nov-2019 | Source : NSEShreeOswal Seeds And Chemicals Limited Seeds And Chemicals Limited for the quarter ended 30-Sep-2019 with respect to Regulation 33 of the SEBI (Listing Obligations and Disclosure Requirements) Regulations, 2015.
ShreeOswal Seeds And Chemicals Limited - Outcome of Board Meeting
13-Nov-2019 | Source : NSEShreeOswal Seeds And Chemicals Limited has informed the Exchange regarding Board meeting held on November 12, 2019.
ShreeOswal Seeds And Chemicals Limited - Statement of deviation(s) or variation(s) under Reg. 32
25-Oct-2019 | Source : NSEShreeOswal Seeds And Chemicals Limited Limited has informed the Exchange regarding Statement of deviation(s) or variation(s) under Reg. 32 of SEBI (LODR) Regulations 2015
Corporate Actions

No Upcoming Board Meetings

No Dividend history available

Shreeoswal Seeds & Chemicals Ltd has announced 2:10 stock split, ex-date: 18 Aug 23

Shreeoswal Seeds & Chemicals Ltd has announced 1:5 bonus issue, ex-date: 02 Feb 24

No Rights history available
Quality key factors
Valuation key factors
Technicals key factors
 Technical Indicator Scale: Bearish, Mildly Bearish, Sideways, Mildly Bullish, Bullish Turned
 Shareholding Snapshot : Mar 2026
Shareholding Compare (%holding)
Promoters
None
Held by 0 Schemes
Held by 0 FIIs
Anil Kumar Nahata (33.5%)
Himanshu Agarwal (2.61%)
29.61%
Quarterly Results Snapshot (Consolidated) - Mar'26 - QoQ

QoQ Growth in quarter ended Mar 2026 is 2.43% vs 38.82% in Dec 2025
QoQ Growth in quarter ended Mar 2026 is 104.85% vs 132.19% in Dec 2025
Half Yearly Results Snapshot (Consolidated) - Sep'25
Growth in half year ended Sep 2025 is -5.01% vs -2.84% in Sep 2024

Growth in half year ended Sep 2025 is 270.71% vs -189.51% in Sep 2024
Nine Monthly Results Snapshot (Consolidated) - Dec'25
YoY Growth in nine months ended Dec 2025 is -12.69% vs -2.46% in Dec 2024
YoY Growth in nine months ended Dec 2025 is 71.48% vs 558.46% in Dec 2024
Annual Results Snapshot (Consolidated) - Mar'26
YoY Growth in year ended Mar 2026 is 0.94% vs -8.59% in Mar 2025
YoY Growth in year ended Mar 2026 is 104.53% vs 184.86% in Mar 2025
About Shreeoswal Seeds & Chemicals Ltd

Company Coordinates


