
Compare Shreeoswal Seeds with Similar Stocks
Dashboard
Weak Long Term Fundamental Strength with a -3.04% CAGR growth in Net Sales over the last 5 years
- Low ability to service debt as the company has a high Debt to EBITDA ratio of 0.41 times
- The company has been able to generate a Return on Equity (avg) of 8.51% signifying low profitability per unit of shareholders funds
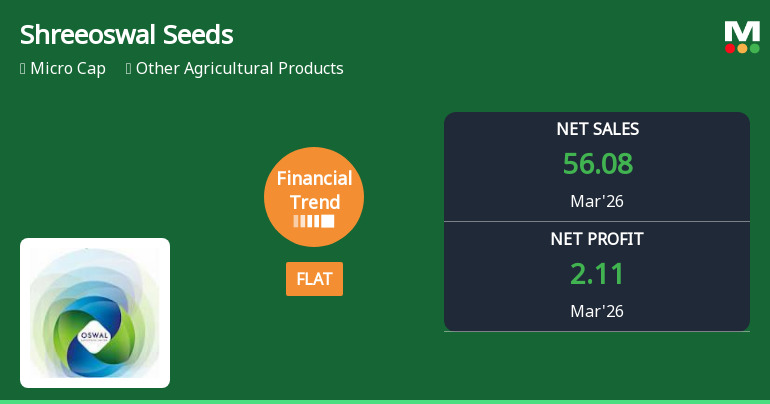
Flat results in Mar 26
Below par performance in long term as well as near term
Stock DNA
Other Agricultural Products
INR 102 Cr (Micro Cap)
14.00
14
0.00%
0.09
14.15%
1.99
Total Returns (Price + Dividend) 
Shreeoswal Seeds for the last several years.
Risk Adjusted Returns v/s
Returns Beta

News
Shreeoswal Seeds & Chemicals Ltd Reports Stabilised Quarterly Performance Amid Mixed Financial Signals
Shreeoswal Seeds & Chemicals Ltd, a micro-cap player in the Other Agricultural Products sector, has reported a flat financial performance for the quarter ended March 2026, signalling a stabilisation after a period of decline. While certain key metrics such as return on capital employed (ROCE) and quarterly profit after tax (PAT) have shown improvement, other indicators including six-month PAT growth and interest expenses continue to weigh on the company’s outlook.
Read full news article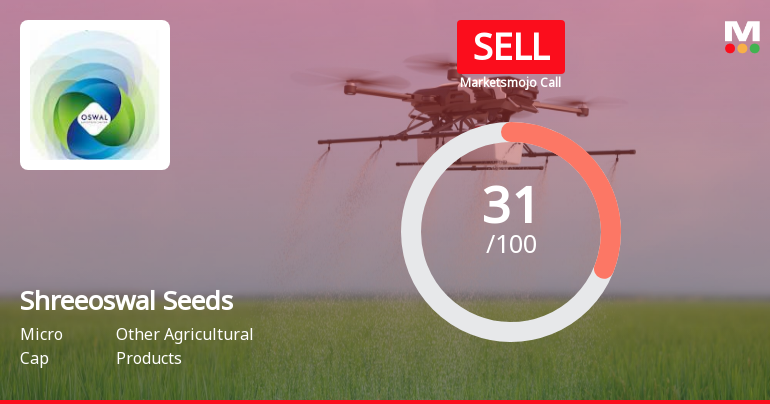
Shreeoswal Seeds & Chemicals Ltd is Rated Sell
Shreeoswal Seeds & Chemicals Ltd is rated 'Sell' by MarketsMOJO as of 02 June 2026. This rating was last updated on 02 June 2026, reflecting a change from the previous 'Strong Sell' grade. The analysis below presents the stock’s current fundamentals, returns, and financial metrics as of today, providing investors with an up-to-date view of the company’s position.
Read full news articleAre Shreeoswal Seeds & Chemicals Ltd latest results good or bad?
ShreeOswal Seeds & Chemicals Ltd's latest financial results for Q4 FY26 reveal a complex picture marked by significant volatility and underlying operational challenges. The company reported a net profit of ₹2.11 crores, which reflects a substantial quarter-on-quarter increase of 104.85% from a loss of ₹3.20 crores in Q3 FY26. However, this recovery comes after a notably poor prior quarter, raising concerns about the sustainability of such earnings. Revenue for the quarter reached ₹56.08 crores, showing a modest sequential growth of 2.43% from ₹54.75 crores in Q3 FY26, while year-on-year growth appears impressive at 116.94% compared to ₹25.85 crores in Q4 FY25. This year-on-year comparison, however, is against a weak base, indicating potential challenges in maintaining consistent revenue growth. The company's operating profit margin, excluding other income, was reported at 7.20%, which is a decline from 10...
Read full news article Announcements
ShreeOswal Seeds And Chemicals Limited - Clarification - Financial Results
18-Nov-2019 | Source : NSEShreeOswal Seeds And Chemicals Limited Seeds And Chemicals Limited for the quarter ended 30-Sep-2019 with respect to Regulation 33 of the SEBI (Listing Obligations and Disclosure Requirements) Regulations, 2015.
ShreeOswal Seeds And Chemicals Limited - Outcome of Board Meeting
13-Nov-2019 | Source : NSEShreeOswal Seeds And Chemicals Limited has informed the Exchange regarding Board meeting held on November 12, 2019.
ShreeOswal Seeds And Chemicals Limited - Statement of deviation(s) or variation(s) under Reg. 32
25-Oct-2019 | Source : NSEShreeOswal Seeds And Chemicals Limited Limited has informed the Exchange regarding Statement of deviation(s) or variation(s) under Reg. 32 of SEBI (LODR) Regulations 2015
Corporate Actions

No Upcoming Board Meetings

No Dividend history available

Shreeoswal Seeds & Chemicals Ltd has announced 2:10 stock split, ex-date: 18 Aug 23

Shreeoswal Seeds & Chemicals Ltd has announced 1:5 bonus issue, ex-date: 02 Feb 24

No Rights history available
Quality key factors
Valuation key factors
Technicals key factors
 Technical Indicator Scale: Bearish, Mildly Bearish, Sideways, Mildly Bullish, Bullish Turned
 Shareholding Snapshot : Mar 2026
Shareholding Compare (%holding)
Promoters
None
Held by 0 Schemes
Held by 0 FIIs
Anil Kumar Nahata (33.5%)
Himanshu Agarwal (2.61%)
29.61%
Quarterly Results Snapshot (Consolidated) - Mar'26 - QoQ

QoQ Growth in quarter ended Mar 2026 is 2.43% vs 38.82% in Dec 2025
QoQ Growth in quarter ended Mar 2026 is 104.85% vs 132.19% in Dec 2025
Half Yearly Results Snapshot (Consolidated) - Sep'25
Growth in half year ended Sep 2025 is -5.01% vs -2.84% in Sep 2024

Growth in half year ended Sep 2025 is 270.71% vs -189.51% in Sep 2024
Nine Monthly Results Snapshot (Consolidated) - Dec'25
YoY Growth in nine months ended Dec 2025 is -12.69% vs -2.46% in Dec 2024
YoY Growth in nine months ended Dec 2025 is 71.48% vs 558.46% in Dec 2024
Annual Results Snapshot (Consolidated) - Mar'26
YoY Growth in year ended Mar 2026 is 0.94% vs -8.59% in Mar 2025
YoY Growth in year ended Mar 2026 is 104.53% vs 184.86% in Mar 2025
About Shreeoswal Seeds & Chemicals Ltd

Company Coordinates


