
Compare Shrenik with Similar Stocks
Dashboard
With a Negative Book Value, the company has a Weak Long Term Fundamental Strength
- Poor long term growth as Net Sales has grown by an annual rate of -37.14% and Operating profit at -239.47% over the last 5 years
- The company has a negative book value of Rs 175.98 crore
- The company has been able to generate a Return on Equity (avg) of 6.26% signifying low profitability per unit of shareholders funds
Flat results in Mar 26
Risky - Negative EBITDA
Stock DNA
Miscellaneous
INR 23 Cr (Micro Cap)
119.00
23
0.00%
-0.71
-0.11%
-0.13
Total Returns (Price + Dividend) 
Latest dividend: 0.00512 per share ex-dividend date: Sep-08-2020
Risk Adjusted Returns v/s
Returns Beta

News

Shrenik Ltd Locks at Upper Circuit With 2.78% Gain — Buyers Queue, Sellers Absent
At Rs 0.37, the buying was done — not because demand dried up, but because the exchange wouldn't let the stock go any higher. Shrenik Ltd locked at its upper circuit of 2.78% on 19 Jun 2026, with buyers queuing and no sellers willing to part with shares.
Read full news article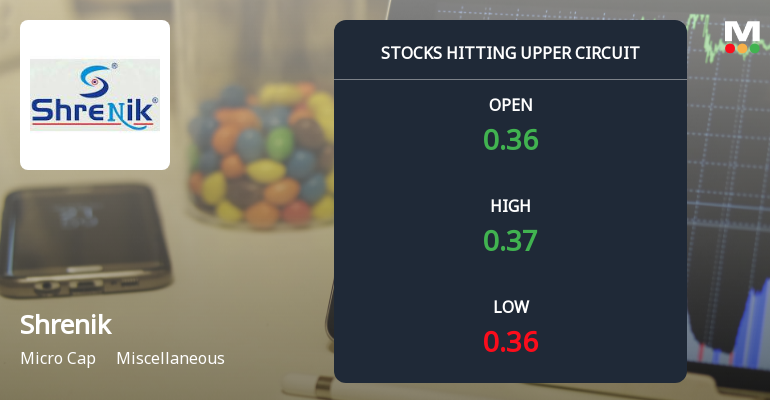
Shrenik Ltd Locks at Upper Circuit With 2.78% Gain — Buyers Queue, Sellers Absent
At Rs 0.37, the buying was done — not because demand dried up, but because the exchange wouldn't let the stock go any higher. Shrenik Ltd locked at its upper circuit of 2.78% on 18 Jun 2026, with buyers queuing and no sellers willing to part with shares.
Read full news article
Shrenik Ltd Locks at Upper Circuit With 2.78% Gain — Buyers Queue, Sellers Absent
At Rs 0.37, the buying was done — not because demand dried up, but because the exchange wouldn't let the stock go any higher. Shrenik Ltd locked at its upper circuit of 2.78% on 17 Jun 2026, with buyers queuing and no sellers willing to part with shares.
Read full news article Announcements
Shrenik Limited - Outcome of Board Meeting
13-Nov-2019 | Source : NSEShrenik Limited has informed the Exchange regarding Outcome of Board meeting held on November 11, 2019 for considering the Financial Statements for the period ended on 30.09.2019
Shareholders meeting
20-Aug-2019 | Source : NSE
| Shrenik Limited has submitted the Exchange a copy Srutinizers report of Annual General Meeting held on August 19, 2019. Further, the company has informed the Exchange regarding voting results. |
Corporate Actions

No Upcoming Board Meetings

Shrenik Ltd has declared 10% dividend, ex-date: 08 Sep 20

Shrenik Ltd has announced 1:2 stock split, ex-date: 08 Oct 20

Shrenik Ltd has announced 2:1 bonus issue, ex-date: 08 Oct 20

No Rights history available
Quality key factors
Valuation key factors
Technicals key factors
 Technical Indicator Scale: Bearish, Mildly Bearish, Sideways, Mildly Bullish, Bullish Turned
 Shareholding Snapshot : Mar 2026
Shareholding Compare (%holding)
Non Institution
99.938
Held by 0 Schemes
Held by 0 FIIs
Shrenik Sudhir Vimawala (24.51%)
None
72.4%
Quarterly Results Snapshot (Standalone) - Mar'26 - YoY

YoY Growth in quarter ended Mar 2026 is 145.26% vs -20.70% in Mar 2025

YoY Growth in quarter ended Mar 2026 is -1,387.50% vs 100.07% in Mar 2025
Half Yearly Results Snapshot (Standalone) - Sep'25
Growth in half year ended Sep 2025 is 77.26% vs -54.42% in Sep 2024
Growth in half year ended Sep 2025 is 250.00% vs 79.59% in Sep 2024
Nine Monthly Results Snapshot (Standalone) - Dec'25
YoY Growth in nine months ended Dec 2025 is 84.69% vs -54.82% in Dec 2024
YoY Growth in nine months ended Dec 2025 is 817.65% vs 70.18% in Dec 2024
Annual Results Snapshot (Standalone) - Mar'26
YoY Growth in year ended Mar 2026 is 99.28% vs -47.06% in Mar 2025
YoY Growth in year ended Mar 2026 is 311.11% vs 99.96% in Mar 2025
About Shrenik Ltd


