
Compare Sh. Jagdamba Pol with Similar Stocks
Total Returns (Price + Dividend) 
Latest dividend: 0.75 per share ex-dividend date: Sep-04-2025
Risk Adjusted Returns v/s
Returns Beta

News

Shri Jagdamba Polymers Ltd is Rated Strong Sell
Shri Jagdamba Polymers Ltd is rated Strong Sell by MarketsMOJO. This rating was last updated on 21 May 2026. However, the analysis and financial metrics presented here reflect the stock’s current position as of 10 June 2026, providing investors with the most recent and relevant data to assess the company’s outlook.
Read full news article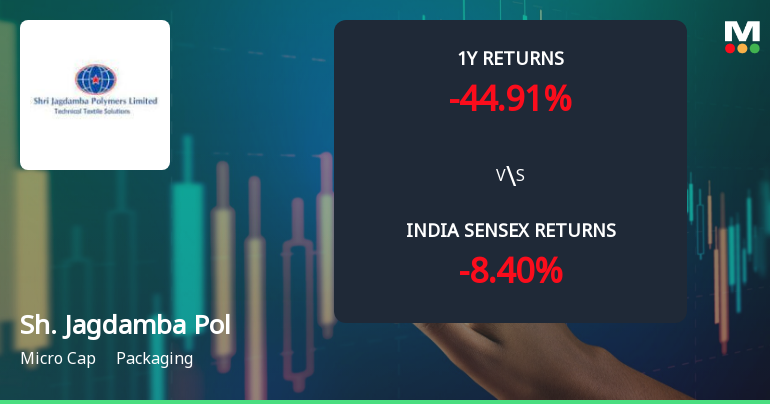
Shri Jagdamba Polymers Ltd Faces Bearish Momentum Amid Technical Downgrade
Shri Jagdamba Polymers Ltd, a micro-cap player in the packaging sector, has experienced a notable shift in its technical momentum, with key indicators signalling a bearish trend. The stock’s recent price action, combined with mixed technical signals, paints a challenging outlook for investors amid broader market pressures.
Read full news article
Shri Jagdamba Polymers Ltd is Rated Strong Sell
Shri Jagdamba Polymers Ltd is rated Strong Sell by MarketsMOJO. This rating was last updated on 21 May 2026, reflecting a reassessment of the stock’s outlook. However, all fundamentals, returns, and financial metrics discussed here are current as of 30 May 2026, providing investors with the latest perspective on the company’s position.
Read full news article Announcements
Compliances-Reg.24(A)-Annual Secretarial Compliance
30-May-2026 | Source : BSEPursuant to Regulation 24A of SEBI (Listing Obligations and Disclosure Requirements) Regulations 2015 please find enclosed the Annual Secretarial Compliance Report issued by G R Shah & Associates Practicing Company Secretaries for the year ended on March 31 2026.
Announcement under Regulation 30 (LODR)-Newspaper Publication
21-May-2026 | Source : BSEPlease find enclosed newspaper publications of the extract of the Audited Standalone and Consolidated Financial Results of the Company for the Quarter and Financial year ended on March 31 2026 published in Financial Express today i.e. May 21 2026 (in English and Gujarati versions ).
Board Meeting Outcome for Outcome Of Board Meeting
19-May-2026 | Source : BSE1. Approved and taken on record Audited Standalone and Consolidated Financial Results for the Quarter and Financial Year ended on March 31 2026 along with Auditors Report on Audited Financial Results 2. Approved the Appointment of Mr. Sachin Solanki Executive Accountant an employee of the company as Internal Auditor for the Financial Year 2026-2027.
Corporate Actions

No Upcoming Board Meetings

Shri Jagdamba Polymers Ltd has declared 75% dividend, ex-date: 04 Sep 25

Shri Jagdamba Polymers Ltd has announced 1:10 stock split, ex-date: 01 Nov 17

No Bonus history available

No Rights history available
Quality key factors
Valuation key factors
Technicals key factors
 Technical Indicator Scale: Bearish, Mildly Bearish, Sideways, Mildly Bullish, Bullish Turned
 Shareholding Snapshot : Mar 2026
Shareholding Compare (%holding)
Promoters
None
Held by 1 Schemes (4.67%)
Held by 1 FIIs (0.02%)
Ramakant Bhojnagarwala (34.23%)
Anjali Ashutosh Taparia (8.11%)
12.08%
Quarterly Results Snapshot (Standalone) - Mar'26 - QoQ

QoQ Growth in quarter ended Mar 2026 is 56.88% vs -41.73% in Dec 2025
QoQ Growth in quarter ended Mar 2026 is 17.00% vs -17.71% in Dec 2025
Half Yearly Results Snapshot (Standalone) - Sep'25

Growth in half year ended Sep 2025 is 1.57% vs 36.34% in Sep 2024
Growth in half year ended Sep 2025 is 26.10% vs 13.98% in Sep 2024
Nine Monthly Results Snapshot (Standalone) - Dec'25
YoY Growth in nine months ended Dec 2025 is -12.85% vs 43.67% in Dec 2024
YoY Growth in nine months ended Dec 2025 is -1.47% vs 31.01% in Dec 2024
Annual Results Snapshot (Consolidated) - Mar'26
YoY Growth in year ended Mar 2026 is -10.49% vs 33.03% in Mar 2025
YoY Growth in year ended Mar 2026 is -22.50% vs 49.02% in Mar 2025
About Shri Jagdamba Polymers Ltd

Company Coordinates


