
Compare Shri Keshav with Similar Stocks
Dashboard
High Debt company with Weak Long Term Fundamental Strength
- Poor long term growth as Net Sales has grown by an annual rate of 14.93% and Operating profit at 11.43% over the last 5 years
- High Debt Company with a Debt to Equity ratio (avg) of 3.96 times
- The company has been able to generate a Return on Capital Employed (avg) of 7.99% signifying low profitability per unit of total capital (equity and debt)
- PBT LESS OI(Q) At Rs -6.94 cr has Fallen at -3117.39%
- PAT(Q) At Rs -9.76 cr has Fallen at -121.3%
- INTEREST(Latest six months) At Rs 12.23 cr has Grown at 30.94%
Stock DNA
Cement & Cement Products
INR 254 Cr (Micro Cap)
NA (Loss Making)
32
0.00%
2.56
-7.27%
2.83
Total Returns (Price + Dividend) 
Latest dividend: 1 per share ex-dividend date: Sep-20-2017
Risk Adjusted Returns v/s
Returns Beta

News
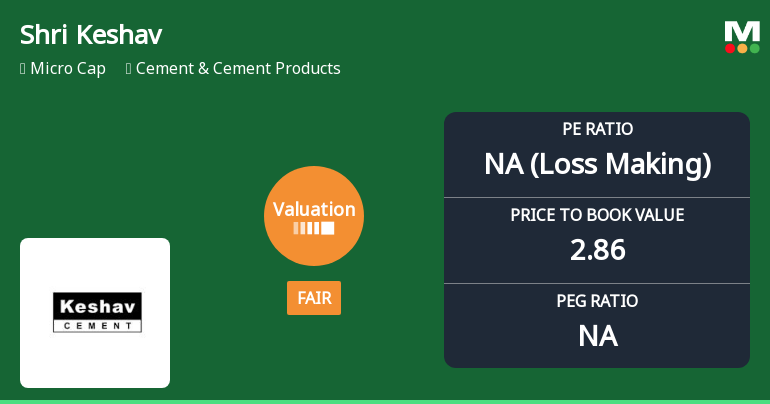
Shri Keshav Cements & Infra Ltd: Valuation Shifts Signal Changing Price Attractiveness
Shri Keshav Cements & Infra Ltd has experienced a notable shift in its valuation parameters, moving from an attractive to a fair valuation grade. This change reflects evolving market perceptions amid challenging financial metrics and sector dynamics, prompting investors to reassess the stock’s price attractiveness relative to its historical and peer benchmarks.
Read full news article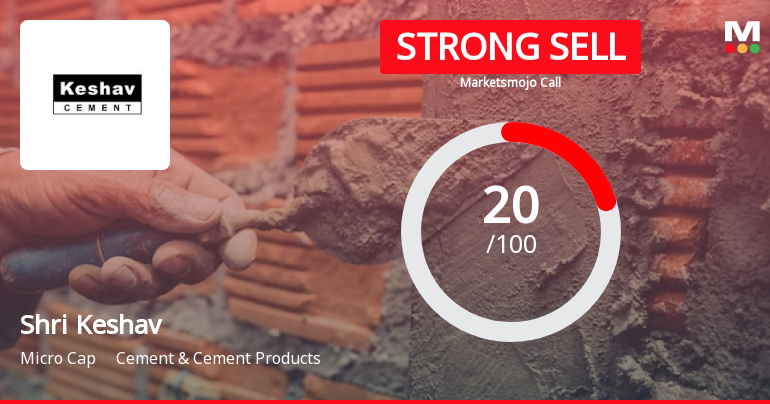
Shri Keshav Cements & Infra Ltd is Rated Strong Sell
Shri Keshav Cements & Infra Ltd is rated Strong Sell by MarketsMOJO, with this rating last updated on 30 May 2026. However, the analysis and financial metrics presented here reflect the stock’s current position as of 01 June 2026, providing investors with the most up-to-date view of the company’s fundamentals, returns, and market performance.
Read full news article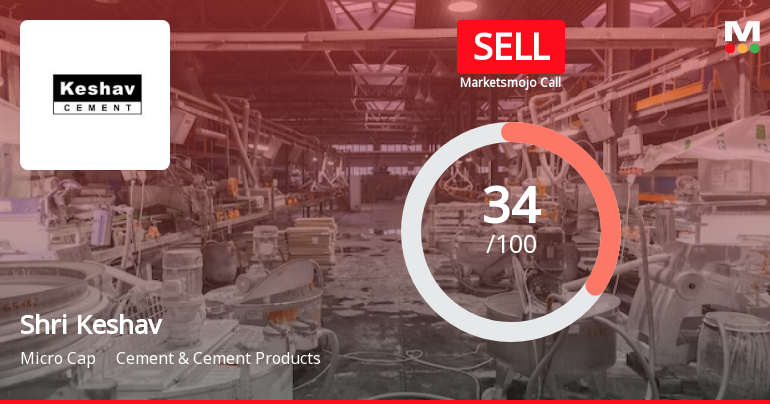
Shri Keshav Cements & Infra Ltd is Rated Sell
Shri Keshav Cements & Infra Ltd is rated Sell by MarketsMOJO. This rating was last updated on 28 Apr 2026, reflecting a change from a previous Strong Sell grade. However, all fundamentals, returns, and financial metrics discussed below are current as of 21 May 2026, providing investors with an up-to-date view of the stock’s position.
Read full news article Announcements
Announcement under Regulation 30 (LODR)-Credit Rating
09-Jun-2026 | Source : BSEWe wish to inform you that Infomerics Ratings has reaffirmed the Ratings to the company as per the below attachment.
Announcement under Regulation 30 (LODR)-Newspaper Publication
30-May-2026 | Source : BSEKindly find enclosed herewith the newspaper Advertisement release in Financial Express and Hasiru Kranti w.r.t. the announcement of Audited Financial Results for the Quarter/Year ended 31/03/2026
Disclosure Under Regulation 30 Of The Securities And Exchange Board Of India (Listing Obligations And Disclosure Requirements) Regulations 2015.
30-May-2026 | Source : BSEAt the Board Meeting Dt 29/05/2026 the Board has approved the following appointments: 1. Re-appointment of M/s. Latkan & Associates as Internal Auditors for FY 26-27 2. Re-appointment of M/s. Santosh Kalburgi & Co as the Cost Auditors for Fy 26-27
Corporate Actions

No Upcoming Board Meetings

Shri Keshav Cements & Infra Ltd has declared 10% dividend, ex-date: 20 Sep 17

No Splits history available

No Bonus history available

Shri Keshav Cements & Infra Ltd has announced 1341:1000 rights issue, ex-date: 18 Sep 19
Quality key factors
Valuation key factors
Technicals key factors
 Technical Indicator Scale: Bearish, Mildly Bearish, Sideways, Mildly Bullish, Bullish Turned
 Shareholding Snapshot : Mar 2026
Shareholding Compare (%holding)
Promoters
None
Held by 0 Schemes
Held by 5 FIIs (10.34%)
Deepak Katwa (12.7%)
Forbes Emf (4.57%)
11.82%
Quarterly Results Snapshot (Standalone) - Mar'26 - YoY

YoY Growth in quarter ended Mar 2026 is 22.98% vs 6.69% in Mar 2025
YoY Growth in quarter ended Mar 2026 is -121.32% vs -282.99% in Mar 2025
Half Yearly Results Snapshot (Standalone) - Sep'25
Growth in half year ended Sep 2025 is 38.60% vs -2.66% in Sep 2024
Growth in half year ended Sep 2025 is 257.50% vs -187.27% in Sep 2024
Nine Monthly Results Snapshot (Standalone) - Dec'25
YoY Growth in nine months ended Dec 2025 is 37.38% vs -8.19% in Dec 2024
YoY Growth in nine months ended Dec 2025 is 284.09% vs -126.19% in Dec 2024
Annual Results Snapshot (Standalone) - Mar'26
YoY Growth in year ended Mar 2026 is 32.82% vs -3.95% in Mar 2025
YoY Growth in year ended Mar 2026 is -5.83% vs -167.58% in Mar 2025
About Shri Keshav Cements & Infra Ltd

Company Coordinates


