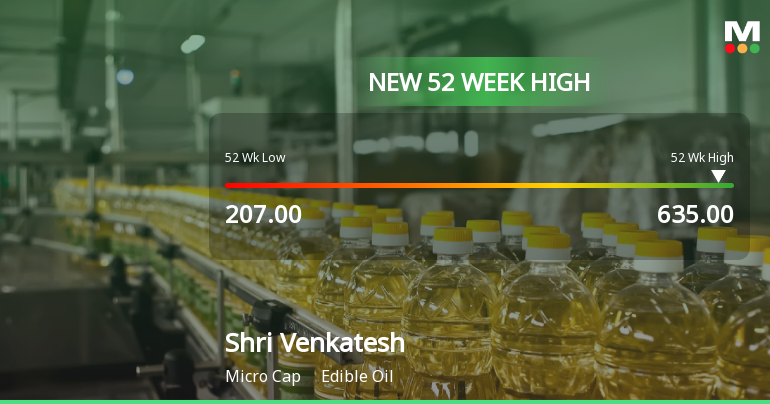
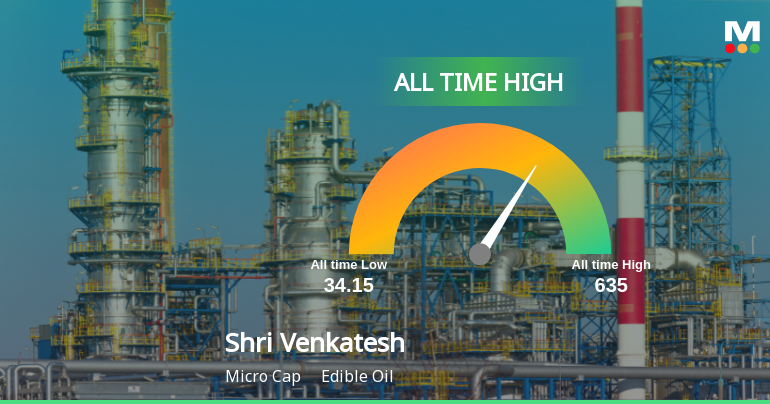
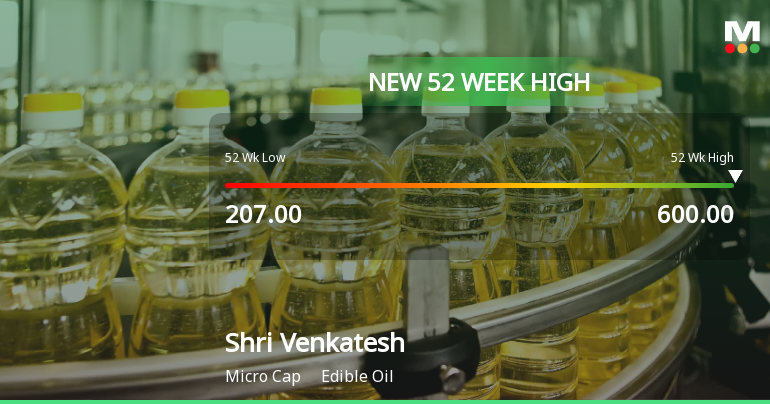
Shri Venkatesh

  • Market Cap: Micro Cap
  • Industry: Edible Oil
  • ISIN: INE0HLJ01013
  • NSEID:
  • BSEID: 543373
INR
611.95
6.15 (1.02%)
BSENSE

Sep 25, 10:38 AM

BSE+NSE Vol: 4120

  • Price Points
  • Score
  • Mojo Parameters
  • Total Return
  • News and Corporate Actions
  • Key factors
  • Shareholding
  • Financials
  • CompanyCV
stock-summaryPrice Point
High/Low

1Day

52 Week

Valuation
Technical
Day's Volume

CASH

4.12 k (60.10%) Volume

Shareholding (Jun 2026)

FII

0.00%

Held by 0 FIIs

DII

0.05%

Held by 0 DIIs

Promoter

73.53%

Why is Shri Venkatesh Refineries Ltd falling/rising?

06-Sep-2026

As of 05-Sep, Shri Venkatesh Refineries Ltd's stock price is at Rs 499.00, reflecting a 2.62% decline and underperforming its sector. Despite increased investor participation, the stock shows short-term weakness with recent consecutive falls and is trading below its 5-day and 20-day moving averages.

As of 05-Sep, Shri Venkatesh Refineries Ltd's stock price is falling, currently at Rs 499.00, which reflects a decrease of Rs 13.45 or 2.62%. The stock has been underperforming, having fallen for the last two consecutive days, resulting in a total decline of 3.85% during this period. Additionally, the stock's performance today is notably below its sector, underperforming by 2.15%. <BR><BR>The stock has also touched an intraday low of Rs 486.85, marking a significant drop of 5%. Although the stock is trading above its 50-day, 100-day, and 200-day moving averages, it is currently below its 5-day and 20-day moving averages, indicating a short-term weakness. <BR><BR>Despite these declines, there has been a rise in investor participation, with delivery volume increasing by 14.62% compared to the 5-day average, suggesting some interest in the stock. However, the overall negative performance in the short term, combined with the recent consecutive falls, contributes to the current downward trend in the stock price.

View full answer

Who are in the management team of Shri Venkatesh?

01-Sep-2026

The management team of Shri Venkatesh includes Dinesh Ganapati Kabre (Chairman & Managing Director), Anil Ganpati Kabre, Shantanu Ramesh Kabre, and Prasad Dinesh Kabre (all Whole-time Directors), along with Independent Directors Anisha Sheshnath Pandey and Sushmita Swarup Lunked, and Divya Jaggi (Company Secretary & Compliance Officer). They oversee the company's operations and governance.

The management team of Shri Venkatesh includes the following individuals:<BR><BR>1. **Dinesh Ganapati Kabre** - Chairman & Managing Director<BR>2. **Anil Ganpati Kabre** - Whole-time Director<BR>3. **Shantanu Ramesh Kabre** - Whole-time Director<BR>4. **Prasad Dinesh Kabre** - Whole-time Director<BR>5. **Anisha Sheshnath Pandey** - Independent Director<BR>6. **Sushmita Swarup Lunked** - Independent Director<BR>7. **Divya Jaggi** - Company Secretary & Compliance Officer<BR><BR>This team is responsible for overseeing the company's operations and governance.

View full answer

What does Shri Venkatesh do?

01-Sep-2026

Shri Venkatesh Refineries Ltd is a micro-cap company in the edible oil industry, reporting net sales of 165 Cr and a net profit of 4 Cr for June 2024. It has a market cap of INR 1,152 Cr and key metrics include a P/E of 77.00 and a debt-equity ratio of 2.32.

Overview:<BR>Shri Venkatesh Refineries Ltd operates in the edible oil industry and is classified as a micro-cap company.<BR><BR>History:<BR>The company was originally incorporated as "Shri Venkatesh Refineries Private Limited" in 2003. It later converted to a public limited company and changed its name to "Shri Venkatesh Refineries Limited" in December 2020. The most recent quarterly results reported net sales and net profit for June 2024.<BR><BR>Financial Snapshot:<BR>Net Sales: 165 Cr (Quarterly Results - Jun 2024) <BR>Net Profit: 4 Cr (Quarterly Results - Jun 2024) <BR>Market Cap: INR 1,152 Cr (Micro Cap)<BR><BR>Key Metrics:<BR>P/E: 77.00 <BR>Industry P/E: 20 <BR>Dividend Yield: 0.19% <BR>Debt-Equity: 2.32 <BR>Return on Equity: 11.54% <BR>Price to Book: 8.76 <BR><BR>Contact Details:<BR>No Company Details Available <BR>Registrar Address: Not available.

View full answer

Who are the peers of the Shri Venkatesh?

01-Sep-2026

Shri Venkatesh's peers include Patanjali Foods, AWL Agri Business, Gokul Agro, CIAN Agro, Sundrop Brands, Kriti Nutrients, Gokul Refoils, Evexia Lifecare, Integ. Proteins, and Vijay Solvex. In terms of performance, Shri Venkatesh has a 1-year return of 121.90%, with management and growth risks rated as average.

Peers: The peers of Shri Venkatesh are Patanjali Foods, AWL Agri Busine., Gokul Agro, CIAN Agro, Sundrop Brands, Kriti Nutrients, Gokul Refoils, Evexia Lifecare, Integ. Proteins, and Vijay Solvex.<BR><BR>Quality Snapshot: Excellent management risk is observed at Kriti Nutrients, while Below Average management risk is found at Patanjali Foods, CIAN Agro, Sundrop Brands, and Integ. Proteins, and Average management risk is present at AWL Agri Busine., Gokul Agro, Gokul Refoils, Evexia Lifecare, and Shri Venkatesh. Growth is Excellent at Gokul Agro and CIAN Agro, Good at Patanjali Foods and Kriti Nutrients, Average at Kriti Nutrients, and Below Average at AWL Agri Busine., Sundrop Brands, Shri Venkatesh, Gokul Refoils, and Evexia Lifecare. Capital Structure is Excellent at Kriti Nutrients, Good at Patanjali Foods, AWL Agri Busine., Gokul Agro, and Integ. Proteins, and Below Average at CIAN Agro, Shri Venkatesh, Gokul Refoils, Evexia Lifecare, and Sundrop Brands.<BR><BR>Return Snapshot: CIAN Agro has the highest 1-year return at 87.50%, while Patanjali Foods has the lowest at -41.84%, with Shri Venkatesh's 1-year return at 121.90% being significantly higher than both. Additionally, Gokul Refoils, Evexia Lifecare, and Patanjali Foods have negative six-month returns.

View full answer

How big is Shri Venkatesh?

01-Sep-2026

As of 31st August, Shri Venkatesh Refineries Ltd has a market capitalization of 1,152.00 Cr, with recent net sales of 587.66 Cr and a net profit of 15.17 Cr. Shareholder's funds are 95.49 Cr, and total assets are 333.82 Cr.

As of 31st August, Shri Venkatesh Refineries Ltd has a market capitalization of 1,152.00 Cr and is classified as a Micro Cap company.<BR><BR>In the latest four quarters, the company reported Net Sales of 587.66 Cr and a Net Profit of 15.17 Cr.<BR><BR>For the latest annual period ending in March 2025, Shareholder's Funds amounted to 95.49 Cr, while Total Assets were reported at 333.82 Cr.

View full answer

Should I buy, sell or hold Shri Venkatesh Refineries Ltd?

07-Jul-2026

When is the next results date for Shri Venkatesh Refineries Ltd?

27-May-2026

The next results date for Shri Venkatesh Refineries Ltd is 30 May 2026.

The next results date for Shri Venkatesh Refineries Ltd is scheduled for 30 May 2026.

View full answer

Is Shri Venkatesh technically bullish or bearish?

02-Dec-2025

As of December 1, 2025, the technical trend has shifted to bullish, supported by strong indicators like a bullish MACD and Bollinger Bands on both weekly and monthly time frames, despite a mildly bearish KST signal on the weekly.

As of 1 December 2025, the technical trend has changed from mildly bullish to bullish. The current stance is bullish with strong indicators supporting this view. The MACD is bullish on both the weekly and monthly time frames, and Bollinger Bands also indicate a bullish trend on both time frames. Daily moving averages confirm a bullish sentiment. Although the KST shows a mildly bearish signal on the weekly, the overall monthly bullishness prevails. The stock has outperformed the Sensex significantly over multiple periods, further reinforcing the bullish outlook.

View full answer

How has been the historical performance of Shri Venkatesh?

15-Nov-2025

Shri Venkatesh has shown significant growth in net sales and profitability, with net sales increasing from 226.84 crore in Mar'19 to 701.64 crore in Mar'25, and profit after tax rising from 1.26 crore to 18.08 crore in the same period. The company has also improved its cash flow and asset base, indicating strong overall performance.

Answer:<BR>The historical performance of Shri Venkatesh shows a significant upward trend in net sales and profitability over the years.<BR><BR>Breakdown:<BR>Shri Venkatesh has demonstrated a robust growth trajectory in its net sales, increasing from 226.84 crore in Mar'19 to 701.64 crore in Mar'25. The total operating income followed a similar pattern, rising from 226.84 crore in Mar'19 to 701.64 crore in Mar'25. The company's total expenditure, excluding depreciation, also increased, reaching 666.01 crore in Mar'25, up from 221.68 crore in Mar'19. Operating profit (PBDIT) has shown a consistent increase, climbing from 5.31 crore in Mar'19 to 36.38 crore in Mar'25, while profit before tax rose from 1.86 crore in Mar'19 to 24.46 crore in Mar'25. Profit after tax also saw a significant rise, growing from 1.26 crore in Mar'19 to 18.08 crore in Mar'25. The company's total assets increased from 67.26 crore in Mar'20 to 333.82 crore in Mar'25, with total liabilities also rising from 67.26 crore to 174.48 crore in the same period. Cash flow from operating activities improved, turning positive at 1 crore in Mar'25 after experiencing negative cash flows in previous years. Overall, Shri Venkatesh has shown a strong performance with increasing revenues, profits, and asset growth over the years.

View full answer

Is Shri Venkatesh overvalued or undervalued?

31-Oct-2025

As of October 30, 2025, Shri Venkatesh is considered very expensive and overvalued with a PE Ratio of 37.63 and an EV to EBITDA of 25.02, significantly higher than competitors like Gokul Agro and Guj. Ambuja, despite its strong stock performance of 69.36% over the past year compared to the Sensex's 5.58%.

As of 30 October 2025, the valuation grade for Shri Venkatesh has moved from expensive to very expensive, indicating a significant increase in perceived valuation. The company is currently considered overvalued. Key ratios include a PE Ratio of 37.63, an EV to EBITDA of 25.02, and a Price to Book Value of 5.98, all of which are substantially higher than its peers.<BR><BR>In comparison, Gokul Agro has a PE Ratio of 18.99 and an EV to EBITDA of 9.44, while Guj. Ambuja is at a PE of 20.58 and an EV to EBITDA of 11.10, illustrating that Shri Venkatesh's valuation metrics are considerably elevated relative to these competitors. Notably, the company's stock has outperformed the Sensex over the past year, with a return of 69.36% compared to the Sensex's 5.58%, but this strong performance does not mitigate the current overvaluation.

View full answer

Are Shri Venkatesh latest results good or bad?

08-Sep-2025

Shri Venkatesh Refineries' latest results show a mixed performance, with a 34.02% increase in Profit After Tax and a five-quarter high in net sales, but rising interest costs and a flat overall quarterly score indicate challenges. The recommendation is to hold the stock due to these mixed indicators.

Shri Venkatesh Refineries has delivered a mixed performance in its latest results for the quarter ending June 2024. While the company has shown some positive trends, there are also areas of concern.<BR><BR>On the positive side, the Profit After Tax (PAT) for the nine-month period has grown significantly by 34.02% year on year, reaching Rs 11.70 crore. Additionally, net sales for the quarter have reached a five-quarter high of Rs 165.27 crore, indicating a positive near-term sales trend. The standalone net profit also saw a modest increase of 3.75% compared to the previous quarter.<BR><BR>However, the overall quarterly performance is described as flat, with a score of -1, which, while an improvement from the previous score of -10, suggests that there are still challenges. The company's interest costs have risen sharply by 24.10%, indicating increased borrowings, which could impact future profitability.<BR><BR>Given these mixed results, the recommendation from MarketsMOJO is to hold the stock. This suggests that while there are some positive indicators, investors should remain cautious due to the rising costs and overall flat performance.

View full answer

Who are the top shareholders of the Shri Venkatesh?

17-Jul-2025

The top shareholder of Shri Venkatesh is Dinesh Ganapati Kabre, holding 18.68%, with no pledged promoter holdings. The highest public shareholder is Kamlesh Ashok Ladhe at 4.7%, and individual investors collectively own 19.69% of the shares.

The top shareholders of Shri Venkatesh include the promoters, with Dinesh Ganapati Kabre holding the largest share at 18.68%. There are no pledged promoter holdings, and the company does not have any mutual fund or foreign institutional investor (FII) holdings. The highest public shareholder is Kamlesh Ashok Ladhe, who holds 4.7%. Additionally, individual investors collectively hold 19.69% of the shares.

View full answer

What is the bonus history of the Shri Venkatesh?

06-Jun-2025

Shri Venkatesh Refineries Ltd recently issued a 1:1 bonus, with an ex-date of October 27, 2023, and a record date of October 28, 2023, meaning shareholders will receive one additional share for each share owned by the record date.

Shri Venkatesh Refineries Ltd has a recent bonus history that includes a 1:1 bonus issue. The ex-date for this bonus was on October 27, 2023, and the record date is set for October 28, 2023. This means that shareholders will receive one additional share for each share they own as of the record date. If you have any more questions about the company or its financial activities, feel free to ask!

View full answer

Has Shri Venkatesh declared dividend?

06-Jun-2025

Yes, Shri Venkatesh has declared a 10% dividend, amounting to ₹1 per share, with an ex-date of September 23, 2024. The current dividend yield is 0.49%, and the company has shown significant price appreciation over various periods.

Shri Venkatesh has declared a dividend.<BR><BR>Dividend Details:<BR>- Percentage announced: 10%<BR>- Amount per share: 1<BR>- Ex-date: 23 Sep 24<BR><BR>Dividend Yield: 0.49%.<BR><BR>Total Returns by Period:<BR>In the last 6 months, the price return was 3.02%, with a dividend return of 0%, resulting in a total return of 3.02%.<BR><BR>Over the past year, the price return was 101.97%, with a dividend return of 0.89%, leading to a total return of 102.86%.<BR><BR>In the 2-year period, the price return was 210.61%, with a dividend return of 2.90%, culminating in a total return of 213.51%.<BR><BR>For the 3-year period, the price return was 248.2%, with a dividend return of 5.77%, resulting in a total return of 253.97%.<BR><BR>In the 4-year period, there was no price return or dividend return, leading to a total return of 0.0%.<BR><BR>Over the last 5 years, there was also no price return or dividend return, resulting in a total return of 0.0%.<BR><BR>Overall, Shri Venkatesh Refineries Ltd has declared a dividend, and while the recent dividend yield is relatively low, the total returns over various periods indicate significant price appreciation, particularly in the longer term.

View full answer
iScoreScore

Dashboard

1

Low ability to service debt as the company has a high Debt to EBITDA ratio of 10.59 times

  • Low ability to service debt as the company has a high Debt to EBITDA ratio of 10.59 times
2

Poor long term growth as Net Sales has grown by an annual rate of -4.48% and Operating profit at -4.80% over the last 5 years

 
3

Flat results in Jun 24

 
4

With ROCE of 6.5, it has a Very Expensive valuation with a 3.8 Enterprise value to Capital Employed

5

Despite the size of the company, domestic mutual funds hold only 0% of the company

6

Market Beating performance in long term as well as near term

stock-summaryMojo Parameters

Mojo Parameters

Loading Valuation Snapshot...

Stock DNA

stock-summary
Industry

Edible Oil

stock-summary
Market cap

INR 1,374 Cr (Micro Cap)

stock-summary
P/E

89.00

stock-summary
Industry P/E

19

stock-summary
Dividend Yield

0.16%

stock-summary
Debt Equity

2.32

stock-summary
Return on Equity

11.54%

stock-summary
Price to Book

10.26

Revenue and Profits:
Net Sales:
165 Cr
(Quarterly Results - Jun 2024)
Net Profit:
4 Cr
stock-summaryTotal Returns
Total Returns (Price + Dividend) stock-summary
Dividend Yield (0.16%)
TimePeriod
Price Return
Dividend Return
Total Return
3 Months
132.15%
0.36%
132.51%
6 Months
135.64%
0.39%
136.03%
1 Year
121.72%
0.35%
122.07%
2 Years
353.3%
1.48%
354.78%
3 Years
502.91%
2.99%
505.9%
4 Years
595.4%
2.84%
598.24%
5 Years
0%
15.78%
15.78%

Latest dividend: 0.9929519750860514 per share ex-dividend date: Sep-24-2026

Risk Adjusted Returns v/s stock-summary
Returns Beta
Icon
Beta has not been calculated since enough price history is not available
stock-summaryNews & Corporate Actions

Announcements stock-summary

Corporate Action-Board approves Dividend

18-Sep-2026 | Source : BSE

Dear Sir/Madam

Fixed Record Date 24Th September 2026 For The Purpose Determining The Members Who Would Be Eligible To Receive Dividend For The Financial Year 2025- 26

18-Sep-2026 | Source : BSE

Dear Sir

Board Meeting Outcome for Outcome Of The Board Meeting

07-Sep-2026 | Source : BSE

Dear Sir

Corporate Actions stock-summary

stock-summary
BOARD MEETING

No Upcoming Board Meetings

stock-summary
DIVIDEND

Shri Venkatesh Refineries Ltd has declared 10% dividend, ex-date: 24 Sep 26

stock-summary
SPLITS

No Splits history available

stock-summary
BONUS

Shri Venkatesh Refineries Ltd has announced 1:1 bonus issue, ex-date: 27 Oct 23

stock-summary
RIGHTS

No Rights history available

stock-summaryKey Factors

Quality key factors stock-summary

Factor
Value
Sales Growth (5y)
-4.48%
EBIT Growth (5y)
-4.80%
EBIT to Interest (avg)
3.68
Debt to EBITDA (avg)
5.25
Net Debt to Equity (avg)
2.32
Sales to Capital Employed (avg)
2.81
Tax Ratio
26.07%
Dividend Payout Ratio
0
Pledged Shares
0
Institutional Holding
0.05%
ROCE (avg)
13.33%
ROE (avg)
18.32%

Valuation key factors

Factor
Value
P/E Ratio
89
Industry P/E
19
Price to Book Value
10.26
EV to EBIT
58.03
EV to EBITDA
55.91
EV to Capital Employed
3.79
EV to Sales
2.82
PEG Ratio
3.62
Dividend Yield
0.16%
ROCE (Latest)
6.53%
ROE (Latest)
11.54%

Technicals key factors

Indicator
Weekly
Monthly
MACD
Bullish
Bullish
RSI
No Signal
Bearish
Bollinger Bands
Bullish
Bullish
Moving Averages
Bullish (Daily)
KST
Bullish
Bullish
Dow Theory
Bullish
Bullish
stock-summary Technical Indicator Scale: Bearish, Mildly Bearish, Sideways, Mildly Bullish, Bullish  Turned 
stock-summaryShareholding
Shareholding Snapshot : Jun 2026stock-summary
Shareholding Compare (%holding) stock-summary
Majority shareholders

Promoters

Pledged Promoter Holdings

None

Mutual Funds

Held by 0 Schemes

FIIs

Held by 0 FIIs

Promoter with highest holding

Dinesh Ganapati Kabre . (18.68%)

Highest Public shareholder

Kamlesh Ashok Ladhe (5.12%)

Individual Investors Holdings

19.17%

stock-summaryFinancial
[
  {
    "link": "quarterly",
    "btn_text": "All Quarterly Results",
    "header": "Quarterly Results Snapshot (Standalone) - Jun'24 - QoQ",
    "rhs": [
      {
        "prefix": "Net Sales ",
        "suffix": "QoQ Growth in quarter ended Jun 2024 is 1.14% vs 31.20% in Mar 2024",
        "dir": -1
      },
      {
        "prefix": "Standalone Net Profit ",
        "suffix": "QoQ Growth in quarter ended Jun 2024 is 3.75% vs -16.59% in Mar 2024",
        "dir": 1
      }
    ],
    "table": {
      "header": [
        "Jun'24",
        "Mar'24",
        "Change(%)"
      ],
      "body": [
        {
          "field": "Net Sales",
          "val1": "165.27",
          "val2": "163.40",
          "chgp": "1.14%",
          "chgp_class": "positive"
        },
        {
          "field": "Operating Profit (PBDIT) excl Other Income",
          "val1": "7.70",
          "val2": "3.98",
          "chgp": "93.47%",
          "chgp_class": "positive"
        },
        {
          "field": "Interest",
          "val1": "2.60",
          "val2": "-0.80",
          "chgp": "425.00%",
          "chgp_class": "negative"
        },
        {
          "field": "Exceptional Items",
          "val1": "0.00",
          "val2": "0.00",
          "chgp": "",
          "chgp_class": "neutral"
        },
        {
          "field": "Standalone Net Profit",
          "val1": "3.60",
          "val2": "3.47",
          "chgp": "3.75%",
          "chgp_class": "positive"
        },
        {
          "field": "Operating Profit Margin (Excl OI)",
          "val1": "4.66%",
          "val2": "2.44%",
          "chgp": "2.22%",
          "chgp_class": "positive"
        }
      ]
    }
  },
  {
    "link": "half-yearly",
    "btn_text": "All Half Yearly Results",
    "header": "Half Yearly Results Snapshot (Standalone) - Mar'26",
    "rhs": [
      {
        "prefix": "Net Sales ",
        "suffix": " Growth in half year ended Mar 2026 is 47.82% vs 41.33% in Sep 2025",
        "dir": 1
      },
      {
        "prefix": "Standalone Net Profit ",
        "suffix": " Growth in half year ended Mar 2026 is 65.28% vs 32.47% in Sep 2025",
        "dir": 1
      }
    ],
    "table": {
      "header": [
        "Mar'26",
        "Sep'25",
        "Change(%)"
      ],
      "body": [
        {
          "field": "Net Sales",
          "val1": "821.71",
          "val2": "555.87",
          "chgp": "47.82%",
          "chgp_class": "positive"
        },
        {
          "field": "Operating Profit (PBDIT) excl Other Income",
          "val1": "44.87",
          "val2": "28.23",
          "chgp": "58.94%",
          "chgp_class": "positive"
        },
        {
          "field": "Interest",
          "val1": "10.61",
          "val2": "8.66",
          "chgp": "22.52%",
          "chgp_class": "negative"
        },
        {
          "field": "Exceptional Items",
          "val1": "0.00",
          "val2": "0.00",
          "chgp": "",
          "chgp_class": "neutral"
        },
        {
          "field": "Standalone Net Profit",
          "val1": "23.80",
          "val2": "14.40",
          "chgp": "65.28%",
          "chgp_class": "positive"
        },
        {
          "field": "Operating Profit Margin (Excl OI)",
          "val1": "5.46%",
          "val2": "5.08%",
          "chgp": "0.38%",
          "chgp_class": "positive"
        }
      ]
    }
  },
  {
    "link": "nine-monthly",
    "btn_text": "All Nine Monthly Results",
    "header": "Nine Monthly Results Snapshot (Standalone) - Jun'24",
    "rhs": [
      {
        "prefix": "Net Sales ",
        "suffix": "YoY Growth in nine months ended Jun 2024 is 52.27% vs 15.00% in Jun 2024",
        "dir": 1
      },
      {
        "prefix": "Standalone Net Profit ",
        "suffix": "YoY Growth in nine months ended Jun 2024 is 66.51% vs -6.49% in Jun 2024",
        "dir": 1
      }
    ],
    "table": {
      "header": [
        "Jun'24",
        "Jun'24",
        "Change(%)"
      ],
      "body": [
        {
          "field": "Net Sales",
          "val1": "721.14",
          "val2": "473.59",
          "chgp": "52.27%",
          "chgp_class": "positive"
        },
        {
          "field": "Operating Profit (PBDIT) excl Other Income",
          "val1": "35.93",
          "val2": "22.68",
          "chgp": "58.42%",
          "chgp_class": "positive"
        },
        {
          "field": "Interest",
          "val1": "11.26",
          "val2": "8.01",
          "chgp": "40.57%",
          "chgp_class": "negative"
        },
        {
          "field": "Exceptional Items",
          "val1": "0.00",
          "val2": "0.00",
          "chgp": "",
          "chgp_class": "neutral"
        },
        {
          "field": "Standalone Net Profit",
          "val1": "18.00",
          "val2": "10.81",
          "chgp": "66.51%",
          "chgp_class": "positive"
        },
        {
          "field": "Operating Profit Margin (Excl OI)",
          "val1": "4.98%",
          "val2": "4.79%",
          "chgp": "0.19%",
          "chgp_class": "positive"
        }
      ]
    }
  },
  {
    "link": "annual",
    "btn_text": "All Annual Results",
    "header": "Annual Results Snapshot (Standalone) - Mar'26",
    "rhs": [
      {
        "prefix": "Net Sales ",
        "suffix": "YoY Growth in year ended Mar 2026 is 96.34% vs 21.98% in Mar 2025",
        "dir": 1
      },
      {
        "prefix": "Standalone Net Profit ",
        "suffix": "YoY Growth in year ended Mar 2026 is 111.28% vs 20.29% in Mar 2025",
        "dir": 1
      }
    ],
    "table": {
      "header": [
        "Mar'26",
        "Mar'25",
        "Change(%)"
      ],
      "body": [
        {
          "field": "Net Sales",
          "val1": "1,377.57",
          "val2": "701.64",
          "chgp": "96.34%",
          "chgp_class": "positive"
        },
        {
          "field": "Operating Profit (PBDIT) excl Other Income",
          "val1": "73.10",
          "val2": "35.63",
          "chgp": "105.16%",
          "chgp_class": "positive"
        },
        {
          "field": "Interest",
          "val1": "19.27",
          "val2": "10.60",
          "chgp": "81.79%",
          "chgp_class": "negative"
        },
        {
          "field": "Exceptional Items",
          "val1": "0.00",
          "val2": "0.00",
          "chgp": "",
          "chgp_class": "neutral"
        },
        {
          "field": "Standalone Net Profit",
          "val1": "38.20",
          "val2": "18.08",
          "chgp": "111.28%",
          "chgp_class": "positive"
        },
        {
          "field": "Operating Profit Margin (Excl OI)",
          "val1": "5.31%",
          "val2": "5.08%",
          "chgp": "0.23%",
          "chgp_class": "positive"
        }
      ]
    }
  }
]

Quarterly Results Snapshot (Standalone) - Jun'24 - QoQstock-summary

Jun'24
Mar'24
Change(%)
Net Sales
165.27
163.40
1.14%
Operating Profit (PBDIT) excl Other Income
7.70
3.98
93.47%
Interest
2.60
-0.80
425.00%
Exceptional Items
0.00
0.00
Standalone Net Profit
3.60
3.47
3.75%
Operating Profit Margin (Excl OI)
4.66%
2.44%
2.22%
Values in Rs Cr.
Direction Arrows
Net Sales

QoQ Growth in quarter ended Jun 2024 is 1.14% vs 31.20% in Mar 2024

Direction Arrows
Standalone Net Profit

QoQ Growth in quarter ended Jun 2024 is 3.75% vs -16.59% in Mar 2024

Half Yearly Results Snapshot (Standalone) - Mar'26stock-summary

Mar'26
Sep'25
Change(%)
Net Sales
821.71
555.87
47.82%
Operating Profit (PBDIT) excl Other Income
44.87
28.23
58.94%
Interest
10.61
8.66
22.52%
Exceptional Items
0.00
0.00
Standalone Net Profit
23.80
14.40
65.28%
Operating Profit Margin (Excl OI)
5.46%
5.08%
0.38%
Values in Rs Cr.
Direction Arrows
Net Sales

Growth in half year ended Mar 2026 is 47.82% vs 41.33% in Sep 2025

Direction Arrows
Standalone Net Profit

Growth in half year ended Mar 2026 is 65.28% vs 32.47% in Sep 2025

Nine Monthly Results Snapshot (Standalone) - Jun'24stock-summary

Jun'24
Jun'24
Change(%)
Net Sales
721.14
473.59
52.27%
Operating Profit (PBDIT) excl Other Income
35.93
22.68
58.42%
Interest
11.26
8.01
40.57%
Exceptional Items
0.00
0.00
Standalone Net Profit
18.00
10.81
66.51%
Operating Profit Margin (Excl OI)
4.98%
4.79%
0.19%
Values in Rs Cr.
Direction Arrows
Net Sales

YoY Growth in nine months ended Jun 2024 is 52.27% vs 15.00% in Jun 2024

Direction Arrows
Standalone Net Profit

YoY Growth in nine months ended Jun 2024 is 66.51% vs -6.49% in Jun 2024

Annual Results Snapshot (Standalone) - Mar'26stock-summary

Mar'26
Mar'25
Change(%)
Net Sales
1,377.57
701.64
96.34%
Operating Profit (PBDIT) excl Other Income
73.10
35.63
105.16%
Interest
19.27
10.60
81.79%
Exceptional Items
0.00
0.00
Standalone Net Profit
38.20
18.08
111.28%
Operating Profit Margin (Excl OI)
5.31%
5.08%
0.23%
Values in Rs Cr.
Direction Arrows
Net Sales

YoY Growth in year ended Mar 2026 is 96.34% vs 21.98% in Mar 2025

Direction Arrows
Standalone Net Profit

YoY Growth in year ended Mar 2026 is 111.28% vs 20.29% in Mar 2025

stock-summaryCompany CV
About Shri Venkatesh Refineries Ltd stock-summary
stock-summary
Shri Venkatesh Refineries Ltd
Micro Cap
Edible Oil
Shri Venkatesh Refineries Limited was originally incorporated as "Shri Venkatesh Refineries Private Limited" vide Certificate of Incorporation dated February 28, 2003 issued by the Registrar of Companies, Mumbai. Subsequently, Company status got converted into a Public Limited and name of the Company changed to "Shri Venkatesh Refineries Limited" vide a fresh Certificate of Incorporation dated December 30, 2020 issued by the Registrar of Companies, Maharashtra, Mumbai.
Company Coordinates stock-summary
Icon
No Company Details Available
Footer loading