
Compare Shricon Indus. with Similar Stocks
Stock DNA
Non Banking Financial Company (NBFC)
INR 23 Cr (Micro Cap)
12.00
21
0.00%
0.00
34.28%
3.95
Total Returns (Price + Dividend) 
Shricon Indus. for the last several years.
Risk Adjusted Returns v/s
Returns Beta

News
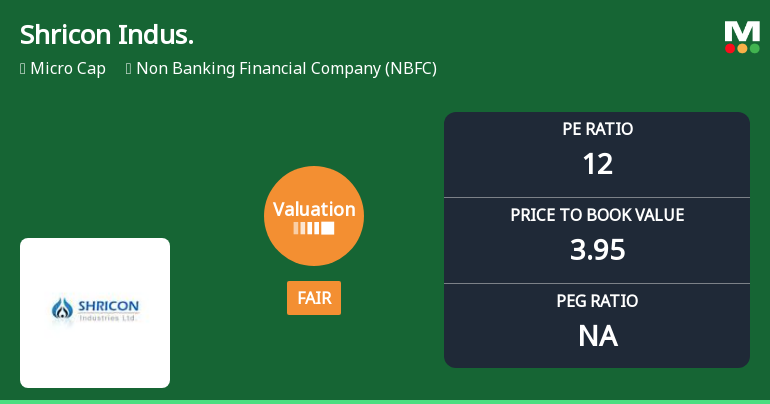
Shricon Industries Ltd Valuation Shifts to Fair Amid Market Volatility
Shricon Industries Ltd, a micro-cap player in the Non Banking Financial Company (NBFC) sector, has recently undergone a notable shift in its valuation parameters, moving from an expensive to a fair valuation grade. This change, accompanied by a downgrade in its Mojo Grade from Hold to Sell, reflects evolving market perceptions and financial metrics that investors must carefully analyse to gauge the stock’s attractiveness amid sector peers and broader market trends.
Read full news article
Shricon Industries Ltd Valuation Shifts to Fair Amidst Market Volatility
Shricon Industries Ltd, a micro-cap player in the Non Banking Financial Company (NBFC) sector, has seen a notable shift in its valuation parameters, moving from an expensive to a fair valuation grade. Despite this adjustment, the stock’s recent performance and peer comparisons suggest a complex investment landscape, with the company’s price-to-earnings (P/E) and price-to-book value (P/BV) ratios reflecting both opportunity and caution for investors.
Read full news article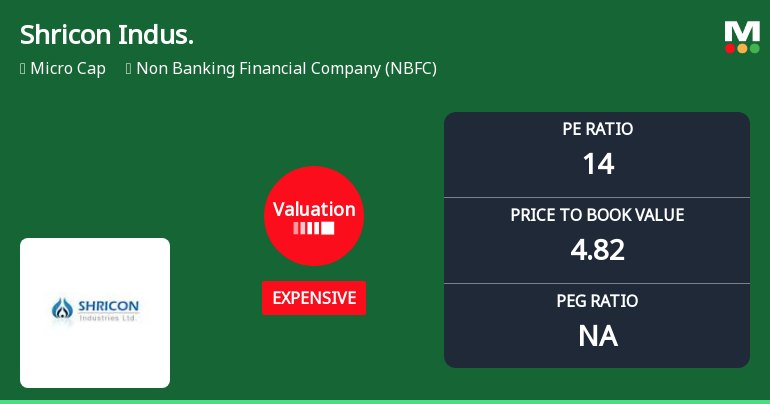
Shricon Industries Ltd Valuation Shifts Amidst Market Volatility
Shricon Industries Ltd, a micro-cap player in the Non Banking Financial Company (NBFC) sector, has experienced a notable shift in its valuation parameters, prompting a downgrade in its investment grade from Hold to Sell. This change reflects a reassessment of the stock’s price attractiveness amid evolving market dynamics and peer comparisons.
Read full news article Announcements
Announcement Under Regulation 30 (LODR)-Newspaper Publication
13-Jul-2026 | Source : BSEPlease find enclosed copies of Newspaper publication regarding completion of dispatch of Annual report Notice of AGM through electronic mode and letter to shareholders.
Reg. 34 (1) Annual Report.
09-Jul-2026 | Source : BSEPlease find attached Annual Report for the Financial Year 2025-26 and Notice convening the 40th Annual General Meeting.
Letter To Shareholders
09-Jul-2026 | Source : BSEPlease find attached letter to Shareholders
Corporate Actions

No Upcoming Board Meetings

No Dividend history available

No Splits history available

No Bonus history available

No Rights history available
Quality key factors
Valuation key factors
Technicals key factors
 Technical Indicator Scale: Bearish, Mildly Bearish, Sideways, Mildly Bullish, Bullish Turned
 Shareholding Snapshot : Mar 2026
Shareholding Compare (%holding)
Promoters
None
Held by 0 Schemes
Held by 0 FIIs
Wellwin Technosoft Ltd (18.73%)
Swastika Investmart Limited (3.96%)
22.52%
Quarterly Results Snapshot (Standalone) - Mar'26 - YoY

YoY Growth in quarter ended Mar 2026 is 232.35% vs 41.67% in Mar 2025
YoY Growth in quarter ended Mar 2026 is 187.50% vs -57.89% in Mar 2025
Half Yearly Results Snapshot (Standalone) - Sep'25
Growth in half year ended Sep 2025 is 312.50% vs -7.69% in Sep 2024

Growth in half year ended Sep 2025 is 54.29% vs 105.88% in Sep 2024
Nine Monthly Results Snapshot (Standalone) - Dec'25
YoY Growth in nine months ended Dec 2025 is 1,085.19% vs -18.18% in Dec 2024
YoY Growth in nine months ended Dec 2025 is 405.88% vs -50.00% in Dec 2024
Annual Results Snapshot (Standalone) - Mar'26
YoY Growth in year ended Mar 2026 is 598.39% vs 8.77% in Mar 2025
YoY Growth in year ended Mar 2026 is 4,000.00% vs -127.78% in Mar 2025
About Shricon Industries Ltd

Company Coordinates


