
Compare Shriram AMC with Similar Stocks
Dashboard
With a Operating Losses, the company has a Weak Long Term Fundamental Strength
- Poor long term growth as Operating profit has grown by an annual rate of -279.78%
Flat results in Mar 26
Risky - Negative EBITDA
Despite the size of the company, domestic mutual funds hold only 0% of the company
Underperformed the market in the last 1 year
Stock DNA
Capital Markets
INR 511 Cr (Micro Cap)
NA (Loss Making)
21
0.00%
0.00
-13.31%
3.37
Total Returns (Price + Dividend) 
Shriram AMC for the last several years.
Risk Adjusted Returns v/s
Returns Beta

News

Shriram Asset Management Co Ltd is Rated Strong Sell
Shriram Asset Management Co Ltd is rated Strong Sell by MarketsMOJO. This rating was last updated on 18 Aug 2025, reflecting a significant reassessment of the stock’s outlook. However, the analysis and financial metrics presented here are based on the company’s current position as of 10 June 2026, providing investors with the latest insights into its performance and prospects.
Read full news article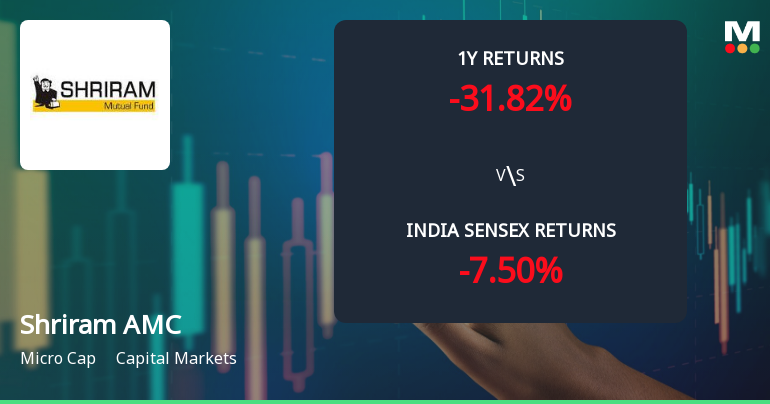
Shriram Asset Management Co Ltd Technical Momentum Shifts Amid Mixed Market Signals
Shriram Asset Management Co Ltd (Shriram AMC) has exhibited a nuanced shift in its technical momentum, moving from a predominantly bearish stance to a mildly bearish outlook. Despite a modest daily gain of 1.09%, the stock remains under pressure with mixed signals from key technical indicators such as MACD, RSI, and moving averages, reflecting ongoing volatility in the capital markets sector.
Read full news article
Shriram Asset Management Co Ltd is Rated Strong Sell
Shriram Asset Management Co Ltd is rated Strong Sell by MarketsMOJO. This rating was last updated on 18 Aug 2025. However, the analysis and financial metrics discussed here reflect the company’s current position as of 26 May 2026, providing investors with the latest insights into its performance and outlook.
Read full news article Announcements
Announcement under Regulation 30 (LODR)-Change in Management
12-Jun-2026 | Source : BSEPlease find enclosed herewith intimation regarding change in Senior Management Personnel of the Company.
Compliances-Certificate under Reg. 74 (5) of SEBI (DP) Regulations 2018
11-Jun-2026 | Source : BSEPlease find attached certificate under Regulation 74(5) of Securities Board of India (Depositories and Participants) Regulations 2018 for the month ended May 31 2026 received from Registrar and Transfer Agent of the Company i.e. Purva Sharegistry (India) Private Limited.
Announcement under Regulation 30 (LODR)-Change in Management
02-Jun-2026 | Source : BSEPlease find attached herewith intimation with respect to Resignation of Senior Management Personnel.
Corporate Actions

No Upcoming Board Meetings

No Dividend history available

No Splits history available

No Bonus history available

No Rights history available
Quality key factors
Valuation key factors
Technicals key factors
 Technical Indicator Scale: Bearish, Mildly Bearish, Sideways, Mildly Bullish, Bullish Turned
 Shareholding Snapshot : Mar 2026
Shareholding Compare (%holding)
Promoters
None
Held by 0 Schemes
Held by 0 FIIs
Shriram Credit Company Limited (47.95%)
Mission 1 Investments Llc (17.63%)
9.1%
Quarterly Results Snapshot (Standalone) - Mar'26 - QoQ

QoQ Growth in quarter ended Mar 2026 is -41.14% vs 17.85% in Dec 2025
QoQ Growth in quarter ended Mar 2026 is -52.99% vs -17.95% in Dec 2025
Half Yearly Results Snapshot (Standalone) - Sep'25

Growth in half year ended Sep 2025 is 57.55% vs 11.50% in Sep 2024
Growth in half year ended Sep 2025 is -16.72% vs -98.07% in Sep 2024
Nine Monthly Results Snapshot (Standalone) - Dec'25
YoY Growth in nine months ended Dec 2025 is 80.79% vs -6.39% in Dec 2024
YoY Growth in nine months ended Dec 2025 is -9.17% vs -154.26% in Dec 2024
Annual Results Snapshot (Standalone) - Mar'26
YoY Growth in year ended Mar 2026 is 82.01% vs -15.99% in Mar 2025
YoY Growth in year ended Mar 2026 is -23.02% vs -140.67% in Mar 2025
About Shriram Asset Management Co Ltd

Company Coordinates


