
Compare Shukra Bullions with Similar Stocks
Dashboard
Weak Long Term Fundamental Strength with an average Return on Equity (ROE) of 6.48%
- Poor long term growth as Net Sales has grown by an annual rate of 11.70% and Operating profit at 1.36% over the last 5 years
- Company's ability to service its debt is weak with a poor EBIT to Interest (avg) ratio of 0.11
Flat results in Mar 26
With ROE of 3.4, it has a Very Expensive valuation with a 8 Price to Book Value
Stock DNA
Diversified Commercial Services
INR 14 Cr (Micro Cap)
238.00
52
0.00%
-0.08
3.35%
7.97
Total Returns (Price + Dividend) 
Shukra Bullions for the last several years.
Risk Adjusted Returns v/s
Returns Beta

News

Shukra Bullions Ltd Downgraded to Strong Sell Amid Technical and Fundamental Concerns
Shukra Bullions Ltd, a micro-cap player in the diversified commercial services sector, has been downgraded from a Sell to a Strong Sell rating by MarketsMOJO as of 13 July 2026. This revision reflects deteriorating technical indicators, weak financial trends, expensive valuation metrics, and declining quality scores, signalling heightened risks for investors despite the stock’s recent market-beating returns.
Read full news article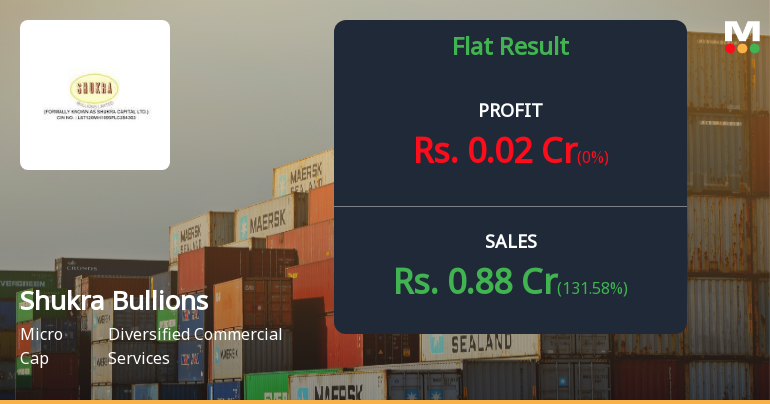
Shukra Bullions Q4 FY26: Micro-Cap Jeweller Swings to Profit Amid Volatile Trading Pattern
Shukra Bullions Ltd., a Mumbai-based micro-cap jewellery manufacturer and diamond trader, reported a modest return to profitability in Q4 FY26 (Mar'26), posting net profit of ₹0.02 crores compared to a loss of ₹0.03 crores in the year-ago quarter. The ₹22.00 crore market capitalisation company, which operates in the highly fragmented diamond-studded gold jewellery segment, delivered net sales of ₹0.88 crores during the quarter, marking a sequential surge of 131.58% but a year-on-year decline of 18.52%.
Read full news article Announcements
Compliances-Certificate under Reg. 74 (5) of SEBI (DP) Regulations 2018
11-Jul-2026 | Source : BSESubmission of Certificate under SEBI (DP) Regulation 2018
SDD Compliance Certificate Under Regulation 3 (5) And 3 (6) Of SEBI (PIT) Regulation 2015.
06-Jul-2026 | Source : BSESDD Compliance Certificate under Regulation 3 (5) and 3 (6) of SEBI (PIT) Regulation 2015.
Announcement under Regulation 30 (LODR)-Code of Conduct under SEBI (PIT) Regulations 2015
01-Jul-2026 | Source : BSEPursuant to Regulation 3(5) and 3(6) of SEBI (PIT)Regulation 2015 please find attached SDD certificate for the quarter ended on 30th June 2026
Corporate Actions

No Upcoming Board Meetings

No Dividend history available

No Splits history available

No Bonus history available

No Rights history available
Quality key factors
Valuation key factors
Technicals key factors
 Technical Indicator Scale: Bearish, Mildly Bearish, Sideways, Mildly Bullish, Bullish Turned
 Shareholding Snapshot : Mar 2026
Shareholding Compare (%holding)
Promoters
None
Held by 1 Schemes (4.98%)
Held by 0 FIIs
Shukra Jewellery Limited (23.83%)
Gaurav Chandrakant Shah (17.95%)
37.91%
Quarterly Results Snapshot (Standalone) - Mar'26 - QoQ

QoQ Growth in quarter ended Mar 2026 is 131.58% vs 5.56% in Dec 2025
QoQ Growth in quarter ended Mar 2026 is 0.00% vs -100.00% in Dec 2025
Half Yearly Results Snapshot (Standalone) - Sep'25
Growth in half year ended Sep 2025 is 12.50% vs 0.00% in Sep 2024

Growth in half year ended Sep 2025 is -62.50% vs 172.73% in Sep 2024
Nine Monthly Results Snapshot (Standalone) - Dec'25
YoY Growth in nine months ended Dec 2025 is 57.45% vs 0.00% in Dec 2024
YoY Growth in nine months ended Dec 2025 is -57.14% vs 158.33% in Dec 2024
Annual Results Snapshot (Standalone) - Mar'26
YoY Growth in year ended Mar 2026 is 3.85% vs 164.41% in Mar 2025
YoY Growth in year ended Mar 2026 is 25.00% vs 100.00% in Mar 2025
About Shukra Bullions Ltd

Company Coordinates


